by Frank Holmes, CIO, CEO, U.S. Global Investors
Share this page with your friends:
Please note: The Frank Talk articles listed below contain historical material. The data provided was current at the time of publication. For current information regarding any of the funds mentioned in these presentations, please visit the appropriate fund performance page.
December 28, 2016

In more ways than one, 2016 was a roller coaster year. One need only look at gold’s performance to confirm this. After rallying more than 30 percent in the first half, the precious metal stalled in the days before the U.S. election, then retreated on a weekly basis, under pressure from a strengthening dollar and tightening monetary policy.
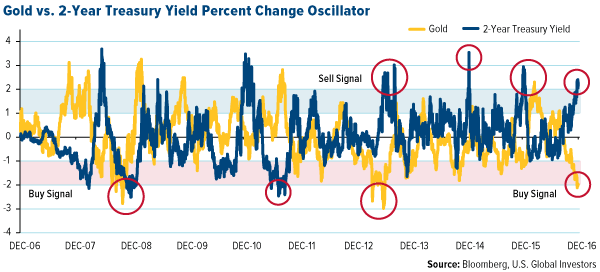
As you can see in the oscillator below, gold is now down more than two standard deviations from its mean, or average, dollar amount. The reason I show you this is because, in the past, this was a good time to begin accumulating, as mean reversion soon followed.
The 2-year Treasury yield, meanwhile, is looking overbought and set to correct, based on our model. I’ve explained several times before how gold has tended to share an inverse relationship with Treasury yields. The math suggests a nearly 90 percent probability that mean reversion will occur over the next three months, with yields falling and the gold price rising back to its mean.
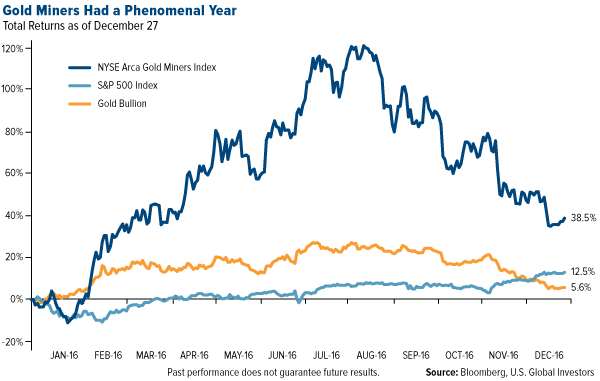
Even though gold stocks have given up a large portion of their gains since the summer, they were still up close to 40 percent for the 12-month period, as measured by the NYSE Arca Gold Miners Index. Over the same period, blue-chip stocks were up 12 percent, with the Trump rally driving most of it. Therefore, a portfolio composed not just of S&P 500 equities but also gold stocks and bullion would likely have performed better than one composed only of equities.
I always recommend a 10 percent weighting in gold, with 5 percent in gold stocks, the other 5 percent in gold bars, coins and jewelry.
Looking Ahead in the Near Term
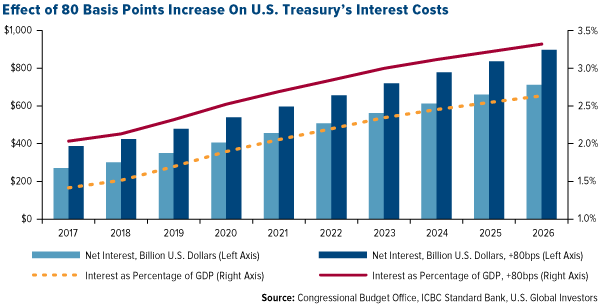
U.S. debt dynamics are expected to turn positive for gold in 2017. That’s according to ICBC Standard Bank, which makes the case that the costs of higher yields are being overlooked. The Congressional Budget Office (CBO) calculates that net interest payments on the nearly $14 trillion of U.S. debt will amount to about $250 billion in 2016—or 1.4 percent of U.S. gross domestic product.
“If we apply an 80 basis point increase to the CBO’s net interest forecasts and keep the other variables unchanged, then by 2026 the Treasury would be paying an additional $185 billion in interest annually, and interest will have increased to 3.3 percent of GDP,” the bank writes, with emphasis my own.
In the note, Tom Kendall, head of precious metals, stresses that the financing costs for the U.S. have already jumped. But under President-elect Donald Trump’s policies—which may or may not have a positive impact on U.S. growth—the effects will likely lag. Any disappointments on the growth front, then, combined with higher interest costs and contentious negotiations on raising the debt ceiling in the first quarter, could well result in a more bullish scenario for gold.
Looking Ahead in the Long Term
Gold’s rarity is one of the key reasons why it’s so highly valued across the globe and for most of recorded human history. Back in August, I shared with you that the precious metal makes up only 0.003 parts per million of the earth’s crust.
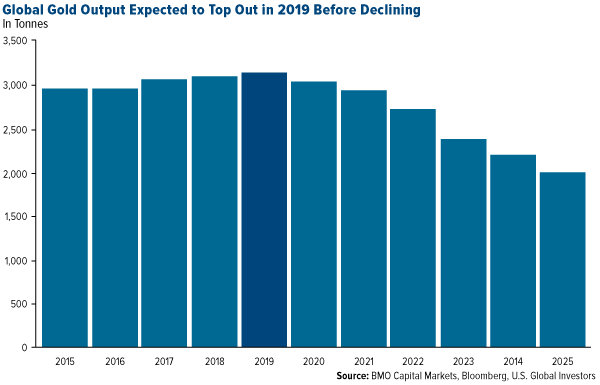
“Peak gold” has been a topic for years now, with major discoveries on the decline. According to a recent Bloomberg article, the number of new gold deposits discovered in 2015 was down a whopping 85 percent since 2006.
This means annual production is expected to peak in 2019, followed by a steady decline until at least 2025.
Regardless of when peak gold might occur, it’s pretty widely accepted that all of the low hanging fruit, with regard to major deposits, has already been picked. As a consequence, we’ll likely see an increase in gold recycling, but the metal’s price could also rise as supply becomes restricted.
All opinions expressed and data provided are subject to change without notice. Some of these opinions may not be appropriate to every investor. By clicking the link(s) above, you will be directed to a third-party website(s). U.S. Global Investors does not endorse all information supplied by this/these website(s) and is not responsible for its/their content.
The NYSE Arca Gold Miners Index is a modified market capitalization weighted index comprised of publicly traded companies involved primarily in the mining for gold and silver. The S&P 500 Stock Index is a widely recognized capitalization-weighted index of 500 common stock prices in U.S. companies.
Standard deviation is a measure of the dispersion of a set of data from its mean. The more spread apart the data, the higher the deviation. Standard deviation is also known as historical volatility.
A basis point, or bp, is a common unit of measure for interest rates and other percentages in finance. One basis point is equal to 1/100th of 1%, or 0.01% (0.0001).
This post was originally published at Frank Talk.
Copyright © U.S. Global Investors


