by LPL Research
In our recently released Outlook 2017: Gauging Market Milestones, we showed why a pickup in earnings growth, stable valuations, and mid-to-late cycle growth should lead to a continuation of the soon to be eight-year-old bull market and likely lead to mid-single-digit equity returns in 2017.
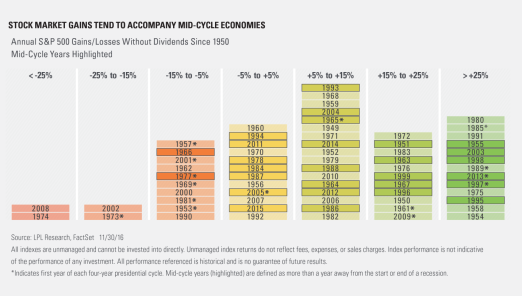
As we presented in the below image, stock market gains tend to happen when the economy is mid-cycle (mid-cycle years are highlighted). This increases the odds of higher equity prices next year, but it is worth noting 2017 is also the first year of the presidential cycle. You can see below those are marked with an asterisk next to the year, and recently, there have been some nice gains during these years.
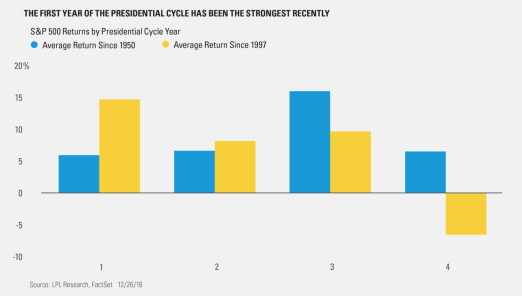
Taking a closer look at this, since 1950,* the first year of the presidential cycle returned only 6.0%—the worst out of the four years. The third year has been historically the strongest, at up 16.1% on average. Per Ryan Detrick, Senior Market Strategist, “The first-year of the presidential cycle might have been weak historically, but interestingly, if you start with more recent action, since 1997 (the first year of Clinton’s second term), the first year of the presidential cycle has been up 14.8% on average and has been the best year out of the four-year cycle, topping the 9.7% return during the typically bullish third year.”
Considering the potentially bullish combo of the first year of the presidential cycle and likely mid-cycle growth, the odds of continued equity gains are strong next year.
*****
IMPORTANT DISCLOSURES
Past performance is no guarantee of future results. All indexes are unmanaged and cannot be invested into directly.
The opinions voiced in this material are for general information only and are not intended to provide or be construed as providing specific investment advice or recommendations for any individual security.
The economic forecasts set forth in the presentation may not develop as predicted.
Investing in stock includes numerous specific risks including: the fluctuation of dividend, loss of principal and potential illiquidity of the investment in a falling market.
*Please note: The modern design of the S&P 500 stock index was first launched in 1957. Performance back to 1950 incorporates the performance of predecessor index, the S&P 90.
The S&P 500 Index is a capitalization-weighted index of 500 stocks designed to measure performance of the broad domestic economy through changes in the aggregate market value of 500 stocks representing all major industries.
This research material has been prepared by LPL Financial LLC.
To the extent you are receiving investment advice from a separately registered independent investment advisor, please note that LPL Financial LLC is not an affiliate of and makes no representation with respect to such entity.
Not FDIC/NCUA Insured | Not Bank/Credit Union Guaranteed | May Lose Value | Not Guaranteed by any Government Agency | Not a Bank/Credit Union Deposit
Securities and Advisory services offered through LPL Financial LLC, a Registered Investment Advisor Member FINRA/SIPC
Tracking # 1-566850 (Exp. 12/17)
Copyright © LPL Research


