by LPL Research
Yesterday on the blog, we noted some potential reasons the Grinch could come for equities, as various levels of sentiment are beginning to get somewhat frothy. With the premiere of How The Grinch Stole Christmas turning 50 years old this Sunday, today we’ll take a look at why you should still believe in Santa and not become a Grinch.
The Santa Claus Rally in December and the likelihood of higher equity returns during this festive month is one of the best-known trading axioms. This is also known as the “December Effect,” first noted by Yale Hirsh in his Stock Trader’s Almanac in 1972. But here’s the catch about the Santa Claus Rally; it isn’t talking about the entire month of December, only the last five days of the year and the first two days of the following year. In fact, as we noted earlier this month, going back to 1950, the S&P 500, on average, is actually flat as of the 15th; then it has frequently seen strong returns over the rest of the month.
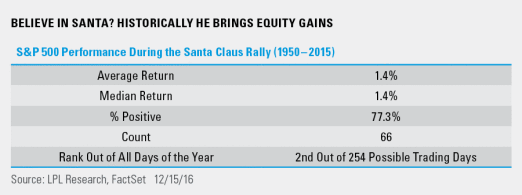
So should you believe in Santa? Going back to 1950* on the S&P 500, looking at the last five days of the year and first two days of the following year, would you believe out of all the days of the year these seven days are the second strongest? That’s right; the days during the Santa Claus Rally have gained 1.4% on average and were higher 77.3% of the time. Looking at all the possible seven-day combinations of the year, only starting on the day with 46 days left in the year (usually around the third week of October) was stronger than the seven days during the Santa Claus Rally. Now that is reason to believe.
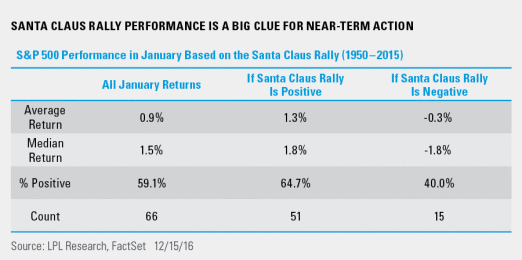
Per Ryan Detrick, Senior Market Strategist, “The Santa Claus Rally isn’t just a bullish time of the year, it is also a great indicator for how January will do. When the seven days of the Santa Claus Rally have been positive, then January has been up 1.3% on average and higher nearly 65% of the time—both better than your average January. Here’s where it gets good; when Santa doesn’t show up, January has been actually down 0.3% on average and higher only 40% of the time. Believe in Santa or not, if he doesn’t show up—the New Year might not start off so well.”
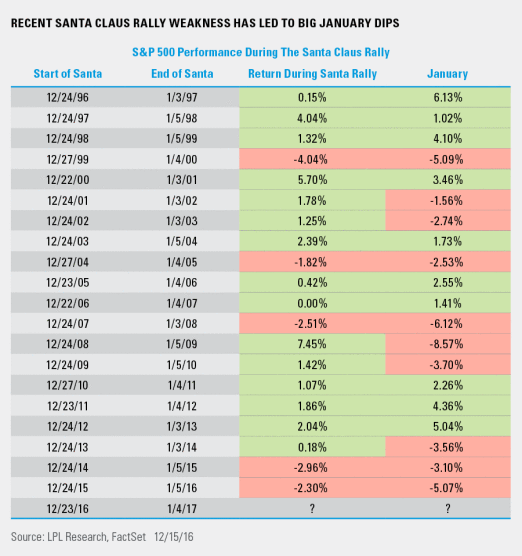
Here are all the recent Santa Claus Rallies and subsequent January performance on the S&P 500 back to 1996. We’d put it like this; not all red Januaries have had a weak Santa Claus Rally during this period, but all weak Santa Claus Rallies have led to a red January. Over the past 20 years, stock market performance during the Santa Claus Rally has been negative five times and the following January was also red all five of those times.

Last, the Santa Claus Rally has been red the past two years, and it hasn’t been down three consecutive years since 1946, 1947, and 1948. Could it happen again? That depends if you feel like a Grinch or not. Merry Christmas and a joyous holiday season to everyone.
*****
IMPORTANT DISCLOSURES
Past performance is no guarantee of future results. All indexes are unmanaged and cannot be invested into directly.
The opinions voiced in this material are for general information only and are not intended to provide or be construed as providing specific investment advice or recommendations for any individual security.
The economic forecasts set forth in the presentation may not develop as predicted.
Investing in stock includes numerous specific risks including: the fluctuation of dividend, loss of principal and potential illiquidity of the investment in a falling market.
*Please note: The modern design of the S&P 500 stock index was first launched in 1957. Performance back to 1950 incorporates the performance of predecessor index, the S&P 90.
The S&P 500 Index is a capitalization-weighted index of 500 stocks designed to measure performance of the broad domestic economy through changes in the aggregate market value of 500 stocks representing all major industries.
This research material has been prepared by LPL Financial LLC.
To the extent you are receiving investment advice from a separately registered independent investment advisor, please note that LPL Financial LLC is not an affiliate of and makes no representation with respect to such entity.
Not FDIC/NCUA Insured | Not Bank/Credit Union Guaranteed | May Lose Value | Not Guaranteed by any Government Agency | Not a Bank/Credit Union Deposit
Securities and Advisory services offered through LPL Financial LLC, a Registered Investment Advisor Member FINRA/SIPC
Tracking # 1-564695 (Exp. 12/17)
Copyright © LPL Research


