by Corey Hoffstein, Newfound Research
Summary
- With significant research into factor rotation in 2016, we expect to see more factor rotation strategies in the market in 2017.
- Using six popular factors (Value, Size, Reinvestment, Operating Profitability, Momentum and Beta), we explore both switching and rotation based strategies.
- We find switching strategies to be largely unimpressive compared to simple buy-and-hold.
- We find factor rotation to have outperformed a passive multi-factor portfolio by 1.32% per year. However, we believe that after fees (i.e. manager fees and transaction costs), the added performance may not be worth the headaches of multi-year drawdowns relative to the simpler approach.If 2016 was the year of multi-factor products, we expect that 2017 will be the year of factor rotation products.
In many ways, 2016 was a year of heavy factor rotation research. Rob Arnott (Research Affiliates) and Cliff Asness (AQR) sparred all year on the topic. To summarize their views:
- The research from Rob and his team at Research Affiliates shows that valuation spreads within factors are important and can provide guidance on potential factor return premiums, if not flash a warning sign about outright factor crashes.For example, Research Affiliates would say that if low volatility stocks are significantly overvalued compared to historical levels (e.g. aggregate price-to-book versus historical average), it may not make sense to hold them.
- Cliff took exception to both the applicability of the research as well as the theory. Largely, his argument hinged on the fact that valuation provides long-term guidance on returns, and therefore says little about high turnover factors.For example, if we know that a small-cap index is trading at a 25 P/E today and our crystal ball tells us that it will be trading at a 15 P/E in five years, that would likely provide us very important information about drag created by valuation contraction.On the other hand, if we know that a momentum index is trading at a 25 P/E today and our crystal ball tells that it will be trading at a 15 P/E in five years, it tells us very little, because it is very unlikely that the portfolio will hold the same stocks a year from today, much less five years. So the contraction in portfolio P/E may be due to changes in holdings and not a contraction in valuation of those holdings.
So who is right? Who is wrong? What is the expected efficacy of factor rotation strategies? Let’s dive in.
Our Hypothesis
Evidence-based research requires having a hypothesis before we do the research. Otherwise, we risk poking around in the dark, finding positive results, and creating a narrative to match those results.
So what is our general hypothesis about factor timing?
Well, if we believe that the factors exist for behavioral reasons (which we largely do), then those same behavioral biases should likely apply to the factors themselves. Therefore we expect that valuation-based timing should be effective for low-turnover factors (e.g. value and size) and momentum-based timing should be effective for all factors.
Well, at least these were our hypotheses when we first started investigating the topic early last year. At this point, we’ve already done a fair amount of research into the topic. In fact, we wrote a paper and submitted it to NAAIM for their annual Founders/Wagner Award competition.
The abstract of the paper was supposed to be 750-1000 words. Instead, we wrote a limerick, which we think nicely summarizes our view:
When outperformance fixation
leads to large inflow temptation:
premiums erode,
investors unload,
enabling factor rotation!
The judges must not have appreciated our creativity, because we didn’t win.
So in short, we believe factor rotation is possible largely because performance-chasing behavior among investors enables it.
The question we should really ask is, however, “is it worth it?”
The Data
In this piece, we’ll be exploring six factors: Value, Size, Operating Profitability, Reinvestment, Momentum, and Beta. Data came from the Kenneth French Data Library.
We use value-weighted portfolios of the top and bottom 30% of stocks ranked by their respective factor. Where the top and bottom 30% were not readily provided, we averaged returns of the bottom three deciles and top three deciles to approximate the value-weighted top and bottom 30%.
For brevity, we’re only going to explore applying momentum as a factor rotation tool. For those interested, we researched a value-based approach in our white paper, Market Timing Factor Premiums: Exploting Behavioral Biases for Fund and Profit.
Factor Switching
The first type of rotation we want to explore is factor switching. The idea behind factor switching is that while factors may have a positive long-term expected premium, they can go through significant periods of underperformance in the short-run.
For example, cheap stocks dramatically underperformed expensive stocks during the dot-com bubble. Small-caps significantly lagged underperformed their large-cap peers during the final throws of the 2008 credit crisis.
In a commentary earlier this year – Even bad strategies will perform well – we argued that not only should this behavior be expected, but it is necessary for the factors to have the long-term expected premium. The ride has to be sufficiently difficult such that the opportunity does not get arbitraged away by an influx of capital.
So what we want to explore is whether we can time switches between the positive and negative sides of the factors.
Positive SideNegative SideValueCheapExpensiveSizeSmallLargeOperating ProfitabilityHighLowReinvestmentLowHighMomentumWinnersLosersBetaLow VolatilityHigh Beta
Note: We use low volatility versus high beta instead of low beta versus high beta or low volatility versus high volatility due to the ETF products that are currently available and how factor switching would likely be applied in the market today.
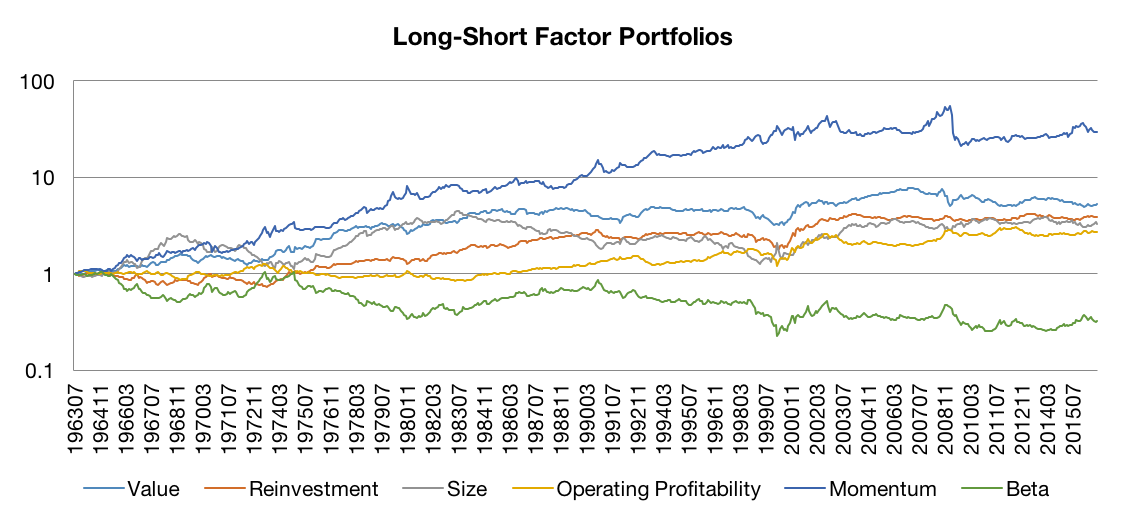
We can examine the historical opportunity in doing so by looking at the returns of the long/short portfolios that are formed by going long the positive side of the factor and short the negative side.
Data Source: Kenneth French Data Library. Calculations by Newfound Research. Portfolios are rebalanced monthly as dollar-neutral long/short portfolios. Past performance is not a guarantee of future returns.
We can see that while the positive side outperforms the negative side, there is significant variation along the way. Therefore, there is potential opportunity in timing this variation.
Note: What’s going on with the Beta portfolio? The problem here is that these are dollar-neutral portfolios, not beta-neutral portfolios. The low-volatility portfolio has a market beta of approximately 0.74 while the high beta portfolio has a market beta of 1.43. So when the market goes up over the long run, the high beta portfolio is simply capturing more of it. A beta-neutral construction (which requires leverage) is where the low-volatility anomaly emerges.
Now the danger here is our timing has to be good enough to overcome the negative drag created when we occassionaly pivot into the negative side of the factor.
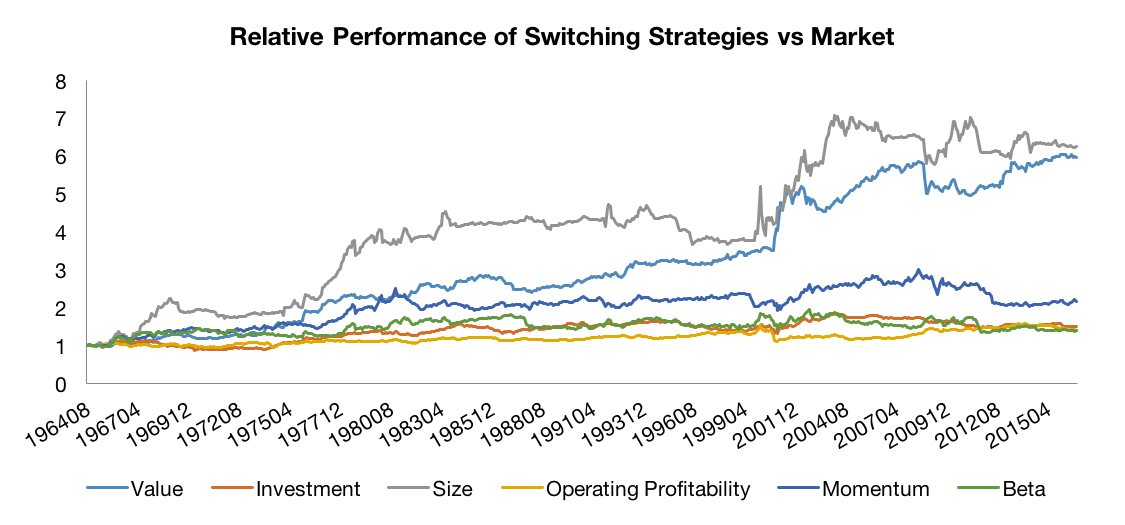
Using a simple 12-1 momentum approach (buy the side of the factor that has done the best over the prior 12 months, ignoring the most recent month), we can see that switching can overcome this negative drag to outperform the market.
Data Source: Kenneth French Data Library. Calculations by Newfound Research. Past performance is not a guarantee of future returns.
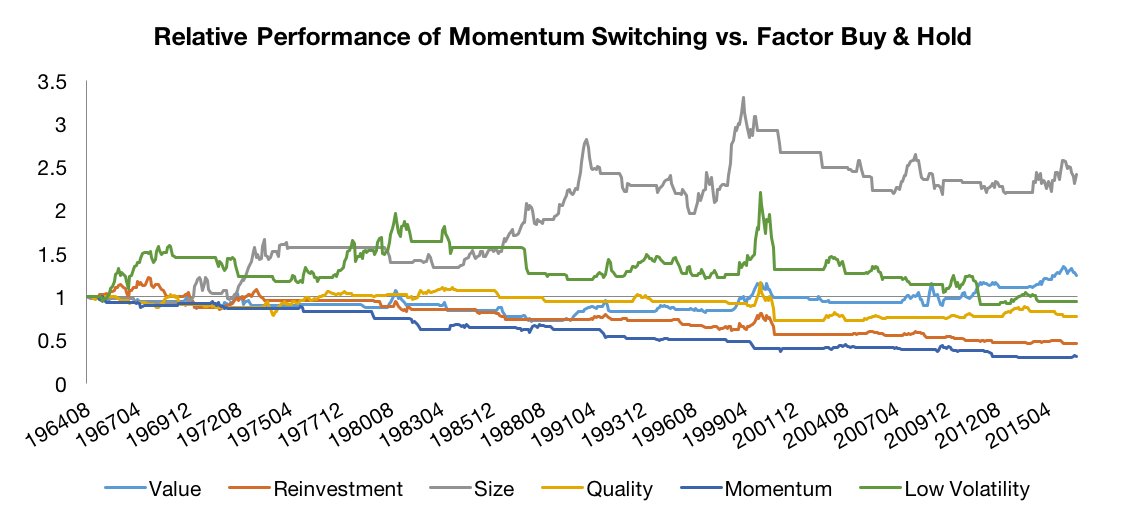
The problem here is that the market is a misleading benchmark. What we should be benchmarking against is the positive side of the factor, i.e. can switching do better than just holding the factor passively?
The answer there is far less convincing.
Data Source: Kenneth French Data Library. Calculations by Newfound Research. Past performance is not a guarantee of future returns.
Switching between large-cap and small-cap is the only approach that has convincingly beat just holding small-cap over the long run. That said, the approach only outperformed by 1.69% per year. If you assume that accessing this strategy would require an active management fee of 0.75% and trading costs of 0.10% per year, this drops to 0.84% per year. Still nothing to scoff at, but when you consider that the approach has been in a relative drawdown to the passive small-cap buy-and-hold since 1999, you start to wonder if it is worth it…
Factor Rotation
So if switching between positive and negative sides seems underwhelming in comparison to just holding the positive side of the factor passively, what about the prospects of rotating between different positive sides?
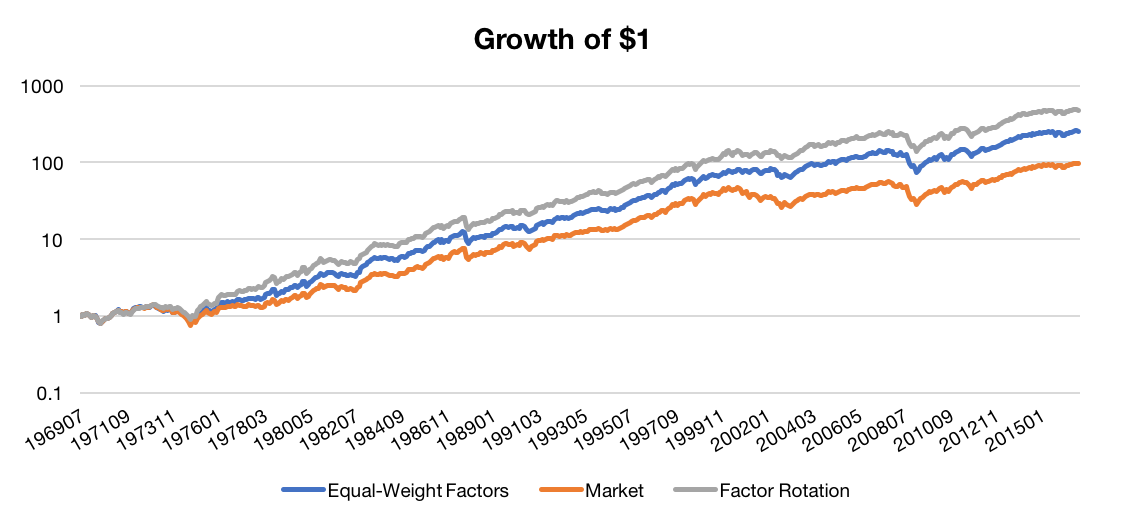
Below we plot the growth of (1) a factor rotation strategy that rebalances monthly using 12-1 momentum to buy the top three performing factors equally, (2) a portfolio that equally weights the factors, and (3) the market.
Data Source: Kenneth French Data Library. Calculations by Newfound Research. Past performance is not a guarantee of future returns.
What we can see is that momentum-based factor rotation not only beats the market, but it also beats a passive, diversified factor portfolio.
Yet once again, the “long-term” may distort the picture. The factor rotation strategy only outperforms the equal-weight factor portfolio by 1.32% per year. If we consider manager costs and transaction costs in the equation (estimating, again, an all-in cost of 0.85%), this relative outperformance falls to 0.47%.
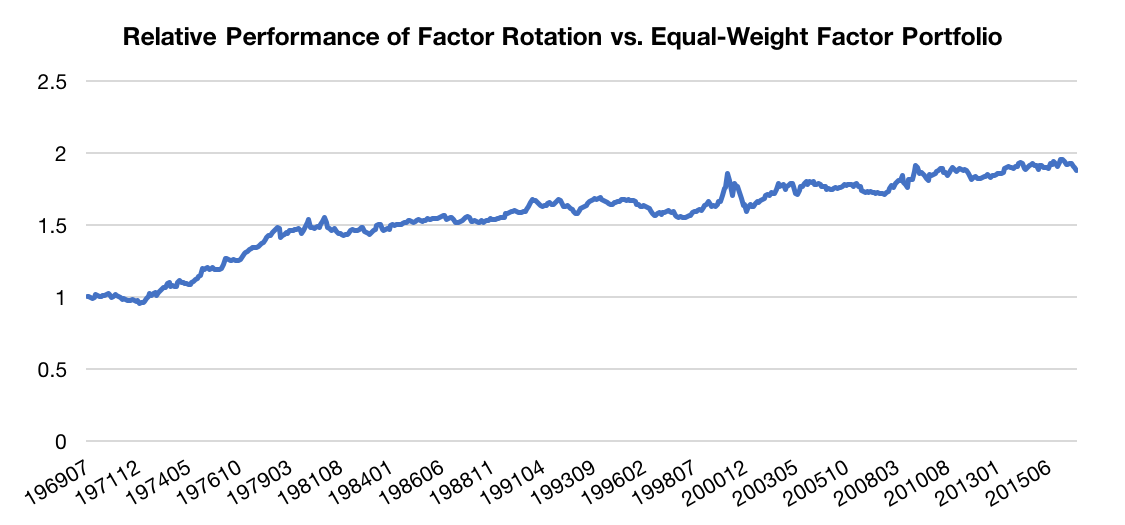
Again, nothing to scoff at, but we should also look at the ride we have to take for it.
Data Source: Kenneth French Data Library. Calculations by Newfound Research. Past performance is not a guarantee of future returns.
The long-term positive trend in reality contains significant periods of underperformance and prolonged drawdowns. For example, after terrific relative performance from 1/1972 to 11/1980, the factor rotation strategy goes through a five year drawdown.
From 1/1994 to 11/1999, the strategy was again underwater. After finally making rapid new relative highs, the approach peaked in 2/2000 and cratered during the dot-com bust. In fact, from 2/2000 to 1/2001, the rotation strategy underperformed the passive strategy by 15 percentage points, and failed to breach its relative highs again until 1/2009.
Mind you, none of this analysis takes fees into account, which would make these drawdowns both longer and deeper.
So yes, we believe factor rotation is a possible and valid strategy. The questions we have to ask ourselves is: “is the post-fee potential high enough to justify the short-term headache?”
Conclusion
We believe that there is conclusive evidence that factor rotation can be an effective means of improving upon passive buy-and-hold multi-factor portfolios. We believe this rotation is enabled by the same causes that create the factors themselves: behavioral biases of investors.
Our research finds that while simple momentum-based switching strategies outperform the broad market, they largely underperform a simple buy-and-hold factor portfolio.
Multi-factor rotation demonstrates more promise, generating an excess return of 1.32% per year compared to the benchmark multi-factor portfolio.
That said, the marginal performance benefit is potentially quickly eroded after management fees, transaction costs, and taxes so investors looking to allocate to these strategies should look for low cost solutions.
Finally, investors should consider whether the potential benefits of factor rotation justify the potential cost of multi-year drawdowns against a passive buy-and-hold portfolio.
Client Talking Points
- Factors go in and out of favor over time.
- Evidence suggests that like sector rotation, we can use a simple momentum approach to time our exposure to factors, generating excess return.
- The potential excess return comes at the potentially large, multi-year relative drawdowns to a simple buy-and-hold multi-factor portfolio
*****
About Corey Hoffstein
Copyright © Newfound Research


