by LPL Research
On Friday, the S&P 500, Dow Jones Industrial Average, and Nasdaq all closed at new all-time highs. The Dow closed above 19,000 for the first time ever three weeks ago; now it is a strong up day or two away from potentially closing above 20,000. It is easy to get caught up in the huge move we’ve seen out of equities since the election, but it is just as important to remember what things were like heading into this move.
We noted many times over the summer how historically tight the trading range was for equities at that time. From the tightest two-year trading range in more than twenty years, to the tightest 30-day range in 50 years, to the least-volatile two-week stretch in 21 years – it all added up to expectations of a big move later this year. In fact, in late July we summed up the lack of movement like this: “Tight ranges don’t stay that way forever, just as volatile times don’t stay volatile forever. History would suggest that tight ranges like we are in now tend to resolve higher.”
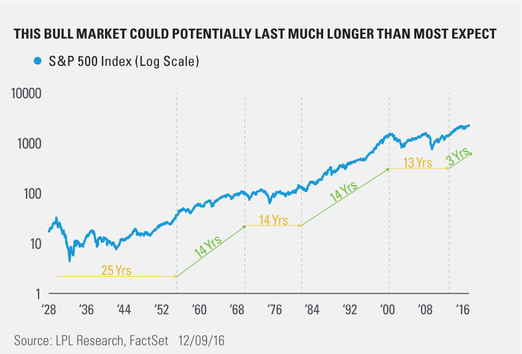
It is now safe to say that has played out very nicely, but how much more could be left in the bull’s tank? As we laid out in Irrational Exuberance Part Two last week, the equity bull market is alive and well according to our methodology based on valuations, fundamentals, and technicals. Let’s take a much bigger picture look at things now. As Ryan Detrick, Senior Market Strategist, noted, “It is easy to get caught up in the near-term volatility of equity markets, but taking a bigger picture look at things sometimes helps to clear up a blurry picture. Doing this shows a nice breakout from a 13-year consolidation and greatly increases the odds of potential strength going forward into at least 2017, if not much further.”
As the chart below shows, the S&P 500 has previously moved from very long periods of sideways action, to a decade-or-longer bull market. After consolidating for 13 years from 2000 to 2013, the current bull market that dates from the breakout to new all-time highs is only three years old. If history repeats once again, this bull market could have much further to run.
IMPORTANT DISCLOSURES
Past performance is no guarantee of future results.
The economic forecasts set forth in the presentation may not develop as predicted.
The opinions voiced in this material are for general information only and are not intended to provide or be construed as providing specific investment advice or recommendations for any individual security.
Investing in stock includes numerous specific risks including: the fluctuation of dividend, loss of principal and potential illiquidity of the investment in a falling market.
The NASDAQ-100 is composed of the 100 largest domestic and international non-financial securities listed on The Nasdaq Stock Market. The Index reflects companies across major industry groups including computer hardware and software, telecommunications, retail/wholesale trade and biotechnology, but does not contain securities of financial companies.
The S&P 500 Index is a capitalization-weighted index of 500 stocks designed to measure performance of the broad domestic economy through changes in the aggregate market value of 500 stocks representing all major industries.
Indices are unmanaged index and cannot be invested into directly. Unmanaged index returns do not reflect fees, expenses, or sales charges. Index performance is not indicative of the performance of any investment.
This research material has been prepared by LPL Financial LLC.
To the extent you are receiving investment advice from a separately registered independent investment advisor, please note that LPL Financial LLC is not an affiliate of and makes no representation with respect to such entity.
Not FDIC/NCUA Insured | Not Bank/Credit Union Guaranteed | May Lose Value | Not Guaranteed by any Government Agency | Not a Bank/Credit Union Deposit
Securities and Advisory services offered through LPL Financial LLC, a Registered Investment Advisor Member FINRA/SIPC
Tracking # 1-563061 (Exp. 12/17)
Copyright © LPL Research


