by LPL Research
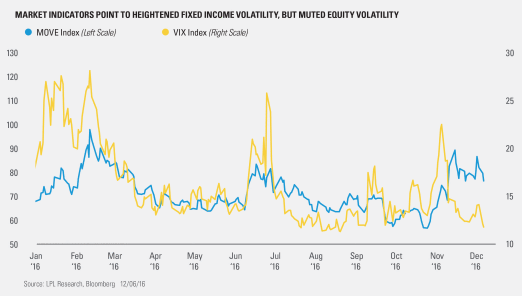
Volatility within stock and bond markets is one of the metrics we track in order to understand market sentiment. While volatility in equity markets has declined from elevated levels seen before the U.S. presidential election, bond market volatility has remained at pre-election heightened levels. This can be seen in the divergence between the level of the Volatility Index (VIX), which is a measure of market expectations of near-term equity volatility conveyed by S&P 500 stock index option prices and the Merrill Lynch Option Volatility Estimate (MOVE) Index, which is a measure of market expectations of near-term fixed income volatility conveyed by Treasury option prices. This divergence indicates that bond markets expect short-term volatility while equity markets do not.
Volatility is important to look at in context. Bond market volatility has been lower than average since the 2007-08 financial crisis, as central bank intervention has muted yields and dampened the effects of other market forces. The MOVE index has averaged 97 over its entire history (6/30/98–12/6/16), but it has averaged approximately 71 over the last five years. So while the reading of 86.6 on December 1, 2016 was on the high side relative to the last five years, it is still low relative to history.
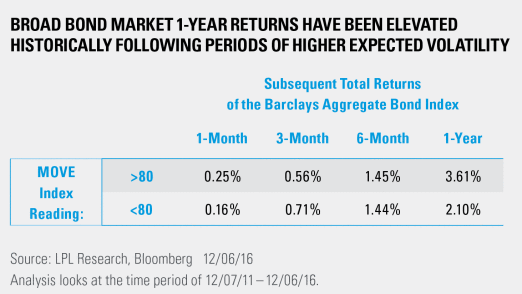
Given the significant changes in the bond market following the financial crisis, looking at the last five years in isolation may lead to more relevant analysis. We do see differences in future return patterns based on whether or not the MOVE is at an elevated level. Over those five years, the MOVE has been above 80 approximately 25% of the time. Subsequently, one-year total returns have historically been higher following those periods of heightened volatility, relative to lower volatility periods.
Despite the encouraging one-year forward return analysis, our base case for the broad bond market, as represented by the Barclays Aggregate index, is for muted, low single-digit returns in 2017. Only time will tell if fixed income volatility will remain elevated, as many investors brace themselves for a potential continuation of the volatility that began in November 2016.
IMPORTANT DISCLOSURES
Past performance is no guarantee of future results. All indexes are unmanaged and cannot be invested into directly.
The opinions voiced in this material are for general information only and are not intended to provide or be construed as providing specific investment advice or recommendations for any individual security.
The economic forecasts set forth in the presentation may not develop as predicted.
Investing in stock includes numerous specific risks including: the fluctuation of dividend, loss of principal and potential illiquidity of the investment in a falling market.
The S&P 500 Index is a capitalization-weighted index of 500 stocks designed to measure performance of the broad domestic economy through changes in the aggregate market value of 500 stocks representing all major industries.
Bonds are subject to market and interest rate risk if sold prior to maturity. Bond values and yields will decline as interest rates rise, and bonds are subject to availability and change in price.
The Barclays U.S. Aggregate Bond Index is a broad-based flagship benchmark that measures the investment-grade, U.S. dollar-denominated, fixed-rate taxable bond market. The index includes Treasuries, government-related and corporate securities, MBS (agency fixed-rate and hybrid ARM pass-throughs), ABS, and CMBS (agency and non-agency).
This research material has been prepared by LPL Financial LLC.
To the extent you are receiving investment advice from a separately registered independent investment advisor, please note that LPL Financial LLC is not an affiliate of and makes no representation with respect to such entity.
Not FDIC/NCUA Insured | Not Bank/Credit Union Guaranteed | May Lose Value | Not Guaranteed by any Government Agency | Not a Bank/Credit Union Deposit
Securities and Advisory services offered through LPL Financial LLC, a Registered Investment Advisor Member FINRA/SIPC
Tracking # 1-562376 (Exp. 12/17)


