by LPL Research
Last week, the Dow Jones Industrial Average closed above the milestone level of 19,000 for the first time in history. This event brought with it a good deal of media attention and questions about what could happen next.
Here are some key things to note regarding big milestone levels:
• The Dow first closed above 100 in January 1906, but traded consistently beneath this level until 1924 and the 1920’s bull market. After the stock market crash of the Great Depression, the Dow last traded beneath 100 on May 26, 1942—some 36 years from the first time it closed above this level.
• The Dow first hit the 1,000 level on an intraday basis on January 18, 1966. It didn’t officially close above this level until November 14, 1972—nearly seven years later. It didn’t break out above 1,000 for another 10 years in late 1982.
• The Dow first closed above 10,000 in early 1999. After two massive bear markets, the last time it closed beneath the 10,000 level was another 11 years later in the summer of 2010.
• All three milestones took place with extended valuations and after strong bull markets, which could help explain why longer-term underperformance occurred.
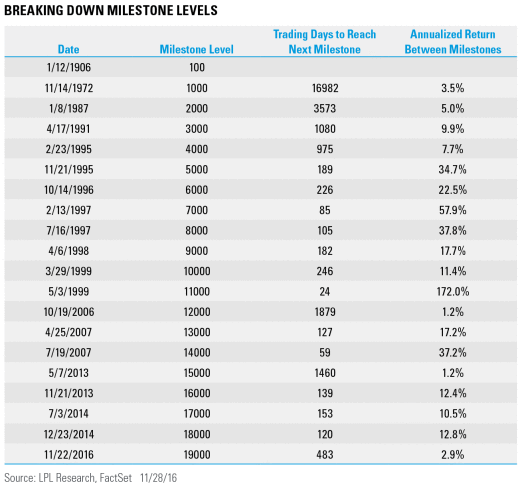
How quickly has the Dow gone from one 1,000 milestone level to the next? The fastest 1,000 point move ever was only 24 days, when it moved from 10,000 to 11,000 in 1999. That move came out to an annualized return of 172%. The longest time between milestones was the move from 1,000 to 2,000, which took over 14 years from late 1972 to early 1987. Of course, a move from 1,000 to 2,000 should take longer, as it is a larger percentage move. Regarding the annualized return, the move from 14,000 to 15,000 took nearly six years, and it came out to an annualized return of 1.2%.
Let’s take another look at the table above. What also stands out is when there is an annualized return of less than 3% (like we just saw from 18,000 to 19,000), historically, some nice gains happened soon after. Given that the latest milestone took so long to occur, this could potentially indicate that the next few milestones will happen quickly.
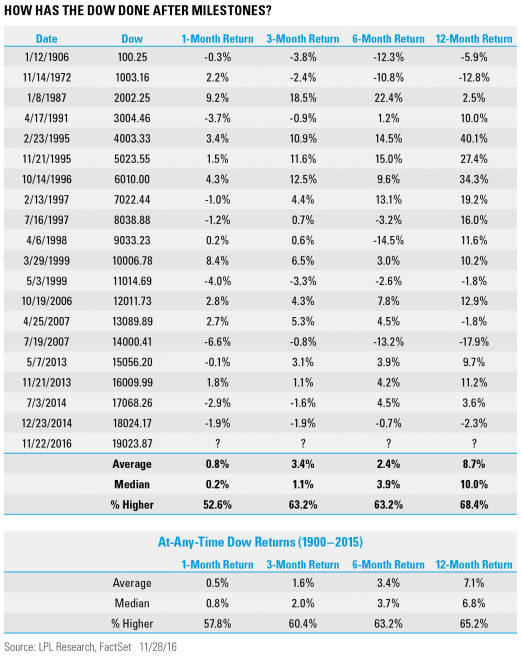
What has happened after one of the milestone levels is cleared? In the near term, there has been underperformance recently, as a month after a milestone has been cleared, the Dow has been lower four of the past five milestones. Looking at all the milestones, the median return a month and three months later is slightly weaker than the at-any-time returns. So some type of weakness isn’t out of the ordinary after these levels are hit, but longer-term they don’t appear to mean much.
Per Ryan Detrick, Senior Market Strategist, “These major milestone levels are a nice reminder that the Dow is at a new high. That always gets investors’ attention and likely a closer look at how their portfolios are positioned, but these levels aren’t magical. In the end, what continues to drive equity prices is valuations, technicals, and fundamentals—not a big round number.”
IMPORTANT DISCLOSURES
Past performance is no guarantee of future results. All indexes are unmanaged and cannot be invested into directly. Unmanaged index returns do not reflect fees, expenses, or sales charges. Index performance is not indicative of the performance of any investment.
The economic forecasts set forth in the presentation may not develop as predicted.
The opinions voiced in this material are for general information only and are not intended to provide or be construed as providing specific investment advice or recommendations for any individual security.
Stock investing involves risk including loss of principal.
The Dow Jones Industrial Average Index is comprised of U.S.-listed stocks of companies that produce other (non-transportation and nonutility) goods and services. The Dow Jones Industrial Averages are maintained by editors of The Wall Street Journal. While the stock selection process is somewhat subjective, a stock typically is added only if the company has an excellent reputation, demonstrates sustained growth, is of interest to a large number of investors, and accurately represents the market sectors covered by the average. The Dow Jones averages are unique in that they are price weighted; therefore, their component weightings are affected only by changes in the stocks’ prices.
To the extent you are receiving investment advice from a separately registered independent investment advisor, please note that LPL Financial LLC is not an affiliate of and makes no representation with respect to such entity.
Not FDIC/NCUA Insured | Not Bank/Credit Union Guaranteed | May Lose Value | Not Guaranteed by any Government Agency | Not a Bank/Credit Union Deposit
Securities and Advisory services offered through LPL Financial LLC, a Registered Investment Advisor
Member FINRA/SIPC
Tracking #1-559314 (Exp. 011/17)
Copyright © LPL Research


