by Mawer Investment Management, via The Art of Boring Blog
Like much of the world, we were somewhat surprised on November 8th as the election results rolled in and Donald Trump was declared the next President of the United States. The victory seemed to shock many market participants since most polls had predicted a Clinton victory leading up to the contest. In fact, even the polling models used on election night failed to predict the result until close to the end of the evening.
So what happened? Why did these models fail to predict the Trump win earlier on election night? The answers are revealing and illustrate some key takeaways for investors.
Political forecasting practitioners, such as Nathan Silver’s team at Five Thirty Eight, make political predictions based on models they build. They use complicated aggregation techniques to capture the available poll data and come up with the likelihood that each candidate will win. Leading up to the election, almost everyone forecasted a Clinton win. Even Mr. Silver’s website, which gave Trump a greater probability of winning, still assumed a victory for the former Secretary of State. The flaw in these models is that they were ill-equipped to respond to real time information as election results came in. This became very apparent on election night.
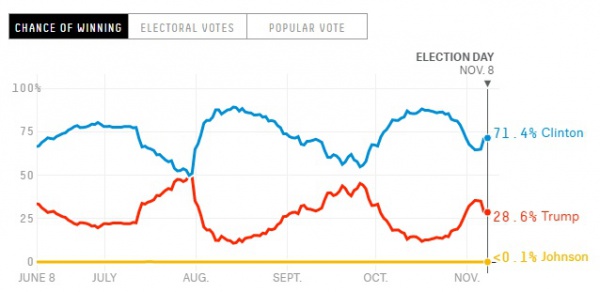
Source: NYT.com
On election night, we spent some time searching for a model that could provide fresh forecasts for the election based on actual data. By far the most responsive model offered online that we found was offered by the New York Times. This tool dynamically adjusted its predictions per state in real time as precinct results came in. But even then, it had its flaws—we noticed them first in the Virginia results.
Virginia was one of the earlier states to be announced. Although Clinton was projected to win the state, initial precincts were being dominated by Trump. It wasn’t until the urban centers near Washington voted that the state swung decidedly for Clinton. Notably, the New York Times tool did a decent job at predicting this outcome. This tool correctly predicted the final results after only a fairly minor percentage of results came in. Although initial results were positive for Trump, the model assumed the major centers would go for Clinton, and this was revealed to be true. At least in this respect, the model seemed to work.
But the Virginia predictions also showed the tool’s flaws. While the NYT model was good at discerning trends within each state, it was not good at extrapolating those trends for other states. While watching the election results that night, it was apparent to viewers pretty early on that Trump had a bigger shot of winning than previously anticipated. As precincts in states such as Virginia and Pennsylvania showed much stronger support for Trump than anticipated, it was apparent that his chances for the Whitehouse were increasing. And still the models didn’t reflect any material shift in probabilities of a Trump win early in the night.
This was their fatal flaw: The models were minimizing the correlations between states.
For example, while Virginia was always forecasted to go to Clinton, the predicted margin of victory was almost 5% tighter than pre-election poll aggregators had forecasted. This was significant information and it happened early on. The geography of Virginia in which Trump was outperforming (relative to the polls) was the center and western part of the state, i.e., the working class. Incidentally, this region has a number of commonalities with regions in Pennsylvania, Michigan and many other mid-western states. If Trump was outperforming in the working class area of Virginia, there was a decent likelihood he’d perform similarly in comparable regions.
When Trump started to dominate in these areas, it represented an almost binary condition; like when you plug in your Christmas lights and all of them turn on at once.
In our view, by missing the inter-state correlations, the model underestimated Trump’s chances by excluding relevant new information. Consequently, the projections from 6:30 pm to 8:00 pm were overly optimistic for Clinton despite the new data. The graph below should have shown a near step-change function around 6:30 pm. Instead it was relatively smooth.
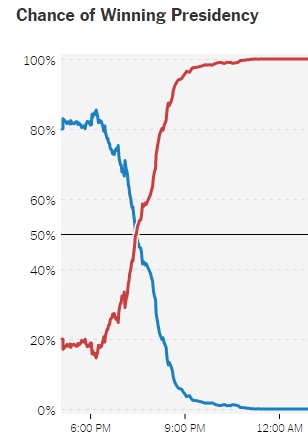
Source: fivethirtyeight.com
So what can we take away from this? For investors, we believe there are three main insights. The first is that there is a tendency to chronically underestimate the degree of correlations in the world. Forecasters often have a problem when it comes to modeling correlations. This was true on November 8 and it is true for the way that many asset classes are modeled in financial markets. Often, in models we assume correlations are fairly low only to be surprised when an event occurs and actual correlations are much tighter than anticipated. Clearly, this was the case with a number of asset classes in the 2008/2009 financial crisis. It has also been generally the case with equities and bonds in recent years.
Second, there is a tendency to anchor ourselves on previous beliefs about the world. At 6:30 pm, the NYT model was overly reliant on dated information in its predictions and was arguably not adequately accounting for new information coming out of Virginia. Investors make a similar mistake all the time in markets. It can take quite a bit of persuasive “new” information to dislodge an “old” thesis.
Third, this inefficiency in processing/weighing new information means that it can take time for a price of an asset to reflect the information that is freely available. Markets may be mostly efficient but the human brain is not. The brain does not easily think in probabilities. The net impact of this micro truth is that, on a macro scale, it can take time for risks or opportunities to get reflected. Sometimes stocks react instantly to a change in the probabilities, other times the reaction is gradual.
As this U.S. election experience revealed, the world is constantly evolving and disproving the hypotheses you previously believed to be true. Updating our beliefs about the world is difficult. The case of Virginia provides an example of this difficulty as “old” information carried too much weight in even the most sophisticated projections. Investors face the same kinds of biases when they are slow to update their world view when new information is released and instead, continue to anchor to their previous world-view. To help combat this bias, it is helpful to remember Virginia.
This post was originally published at Mawer Investment Management