
by Lance Roberts, Clarity Financial
Gross-ly Wrong On Fed Rate Hikes
I just want to get something on the record as we head into the end of the year.
Yesterday, as I was running sprints with my trainer, and about to pass out, I happen to glance up at one of the multitudes of televisions surrounding the workout out floor to glimpse the following headline:
“[Bill] Gross Sees Three Fed Rate Hikes In 2017”
This almost happened.
Here is my point.
Yesterday, the Fed gave a post-FOMC meeting statement that downgraded consumer spending and inflation expectations while still suggesting they will raise rates in December. Interestingly, they noted that employment remains steady without explaining why their own employment measure fails to agree.
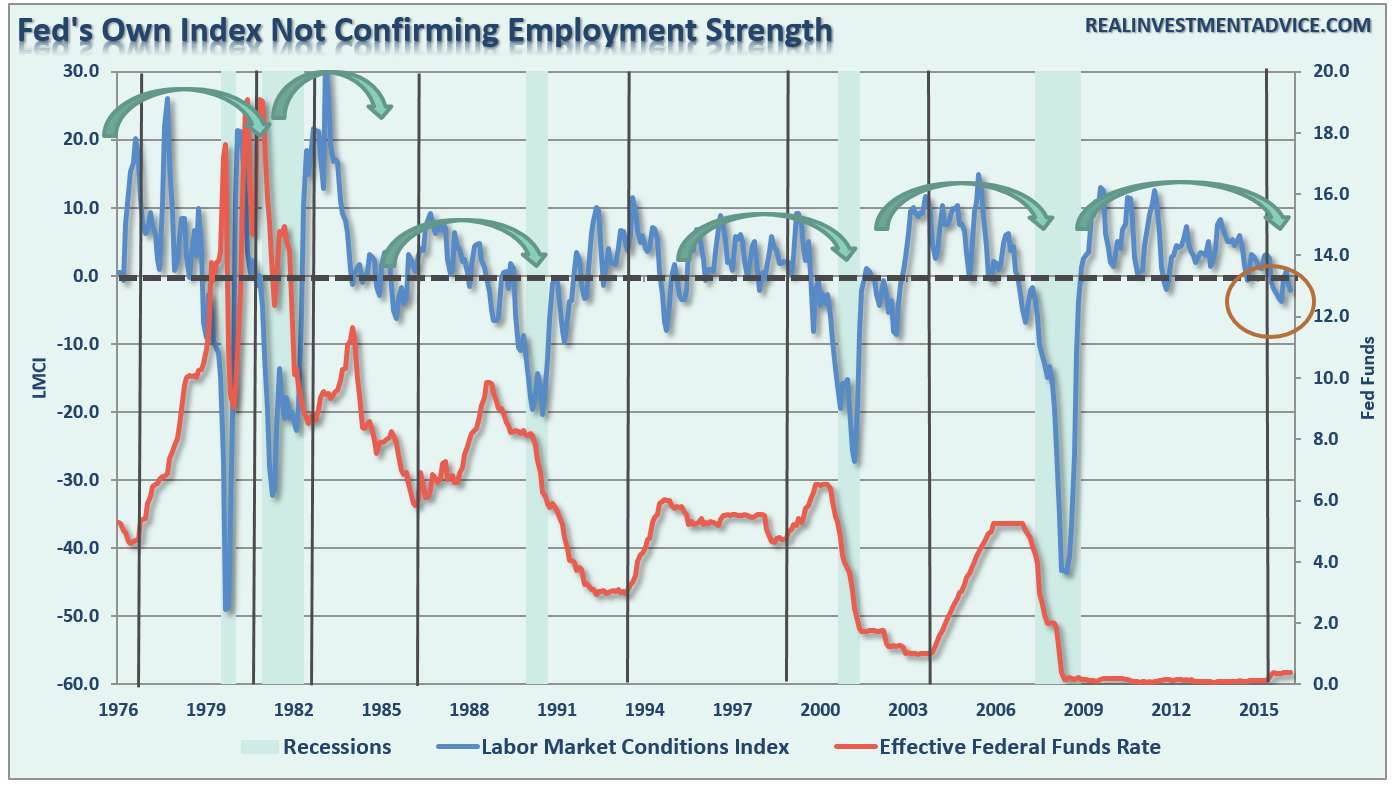
I understand why the Fed wants to raise rates. However, the likelihood they will be able to do so in 2017 is rapidly approaching zero.
In order for the Fed to raise rates, they need stronger levels of economic growth to support to offset the effects of tighter monetary policy. As I have addressed previously, when economic growth is running below 2% there is very little wiggle room to tighten monetary policy without negative outcomes. As discussed recently:
“Outside of inflated asset prices, there is little evidence of real economic growth as witnessed by an average annual GDP growth rate of just 1.3% since 2008, which is the lowest in history….ever. The chart and table below compares real, inflation-adjusted, GDP to Federal Reserve interest rate levels. The gold vertical bars denote the quarter of the first rate hike to the beginning of the next rate decrease or onset of a recession.”
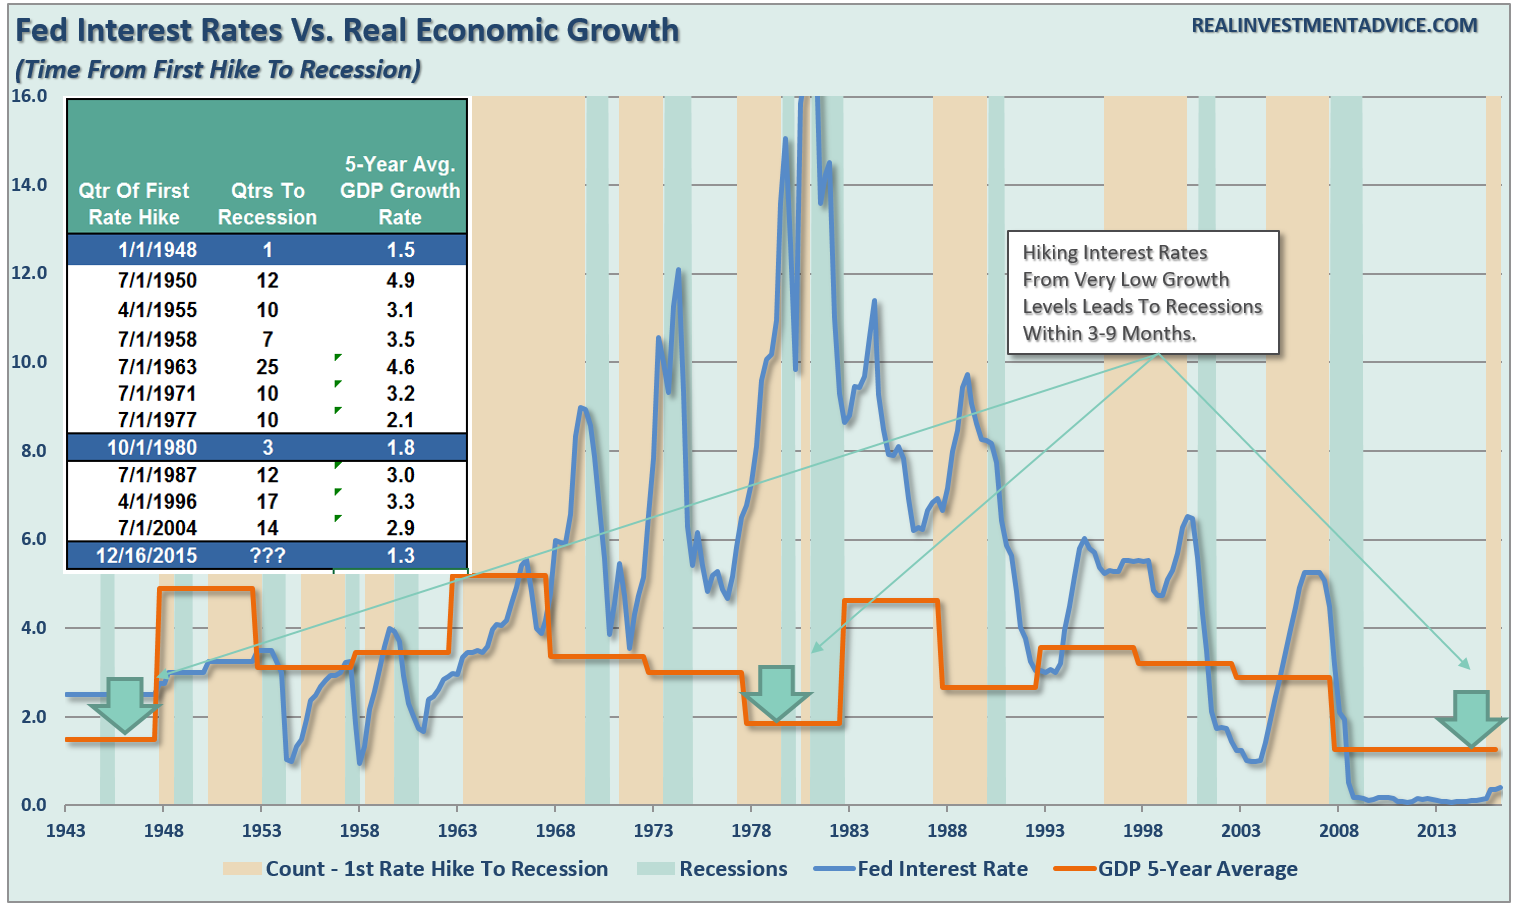
“However, note the GREEN arrows. There have only been TWO previous points in history where real economic growth was below 2% at the time of the first quarterly rate hike – 1948 and 1980. In 1948, the recession occurred ONE-quarter later and THREE-quarters following the first hike in 1980.”
The importance of this reflects the point made previously, the Federal Reserve lifts interest rates to slow economic growth and quell inflationary pressures. There is currently little evidence of inflationary pressures outside of financial asset prices and spiraling rent and health care costs. Therefore, rather than lifting rates when average real economic growth was at 3%, the Fed is now considering further rates hikes with growth at less than half that rate.
Think about it this way. If it has historically taken 11 quarters to fall from an economic growth rate of 3% into recession, then it will take just 1/3rd of that time at a rate of 1%, or 3-4 quarters.
However, despite the weight of evidence already present, there is one indicator the Fed should be paying attention to more closely.
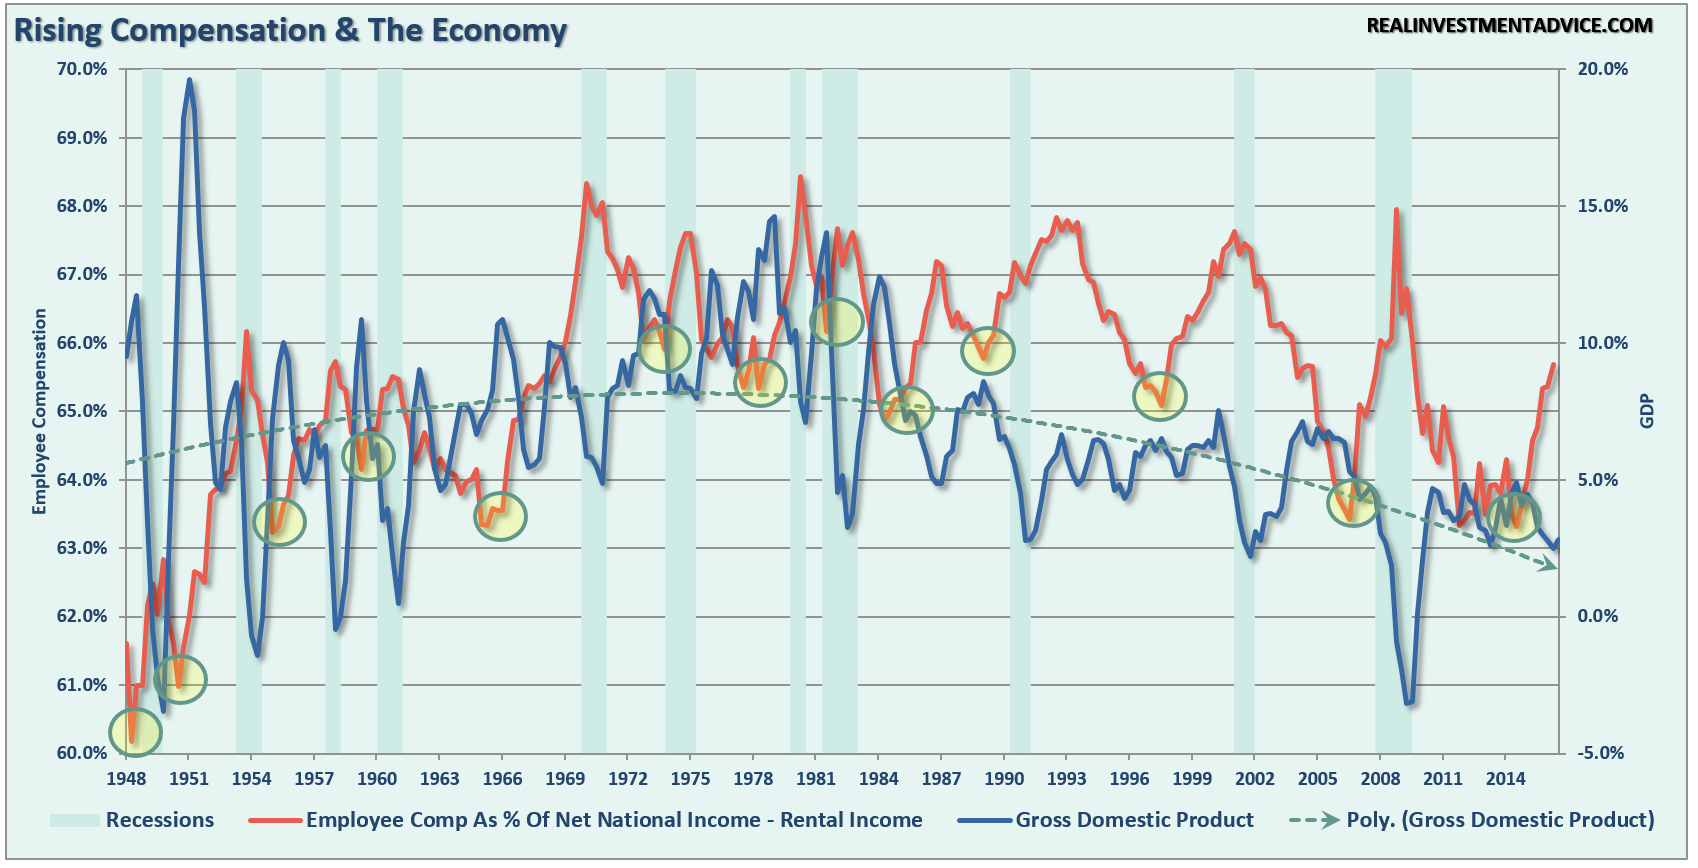
Employee compensation is spiking higher and not because labor is tight, or due to a demand for higher wages (outside of the mandated minimum wage increases in several states) but directly due to the impact of the “Un”-Affordable Care Act. Importantly, rising employment costs impacts have been a precursor to the onset of recessions historically.
As stated in this past weekend’s missive, the risks of a recession have risen markedly in recent months and may arrive in mid-2017. Of course, before we get to that point, the ongoing economic deterioration due to the impact of the stronger dollar and higher interest rates will have already beat the Fed to the “removal of the punch bowl.”
Over the last several months, as market turmoil has increased, the litany of articles on “passive vs. active” investing have multiplied. My position remains that such musings are symbiotic with late stage bull market advances and the eventual market correction will rapidly remind individuals of the consequences of overly simplistic strategies in extremely complex environments.
As I have often stated, the biggest problem with passive indexing strategies is not the destruction of principal from market downturns, but the loss of “time” getting back to even. While capital can eventually be regained over time, the years spent getting back to your starting point simply cannot be replaced. This reality prompted an email from a colleague earlier this week with respect to “the math of loss.”
During ebullient periods in the stock market “investment risk” is disregarded in the pursuit of gains. It is during these times where markets “only seem to go up” that statements such as “investing is about ‘time-in’ the market rather than ‘timing’ the market” are made. Such statements are generally regretted in the not-so-distant future.
There is a major point of clarification that needs to be made here. I completely agree that investors can not be “all in”or “all out” of the market on a consistently correct basis. However, it is at this point in the discussion that some analyst pulls out a chart showing how poor your investment returns would have been if you had missed the “10-best days in the market.”
While that bit of information is true, what is never discussed is the what happens to investor returns when they capture market losses. The table below shows the damage done to an investor’s portfolio during a market draw down and the subsequent return required to get “back to even.”

Even a modest 10% correction requires an 11.11% gain just to get back to even. This is why a strategy of “getting back to even” has never been a worthwhile investment discipline. [Let me repeat: The most important commodity lost during such a period is “time.” Time is the one asset in all portfolios that can never be replaced or recovered. Once it is lost, it is gone forever. Read: “Thoughts On Long Term Investing”]
Conversely, being “all in the market all the time” is just as poor of a strategy as bullish prognosticators forget about the importance of capital destruction as it relates to portfolio returns over time.
There are no great investors of our time that “buy and hold” investments. Even the great Warren Buffett occasionally sells investments. True investors buy when they see value, and sell when value no longer exists.
While there are many sophisticated methods of handling risk within a portfolio, even using a basic method of price analysis, such as a moving average crossover, can be a valuable tool over the long term holding periods. Will such a method ALWAYS be right? Absolutely not. However, will such a method keep you from losing large amounts of capital? Absolutely.
Again, I am not implying, suggesting or stating that such signals mean going 100% to cash. What I am suggesting is that when “sell signals” are given that is the time when individuals should perform some basic portfolio risk management such as:
- Trim back winning positions to original portfolio weights: Investment Rule: Let Winners Run
- Sell positions that simply are not working (if the position was not working in a rising market, it likely won’t in a declining market.) Investment Rule: Cut Losers Short
- Hold the cash raised from these activities until the next buying opportunity occurs. Investment Rule: Buy Low
Missing The 10 Worst Days
The reason that portfolio risk management is so crucial is that it is not “missing the 10-best days” that is important, it is “missing the 10-worst days.” The chart below shows the comparison of $100,000 invested in the S&P 500 Index (log scale base 2) and the return when adjusted for missing the 10 best and worst days.

Clearly, avoiding major draw downs in the market is key to long-term investment success. If I am not spending the bulk of my time making up previous losses in my portfolio, I spend more time compounding my invested dollars towards my long term goals.
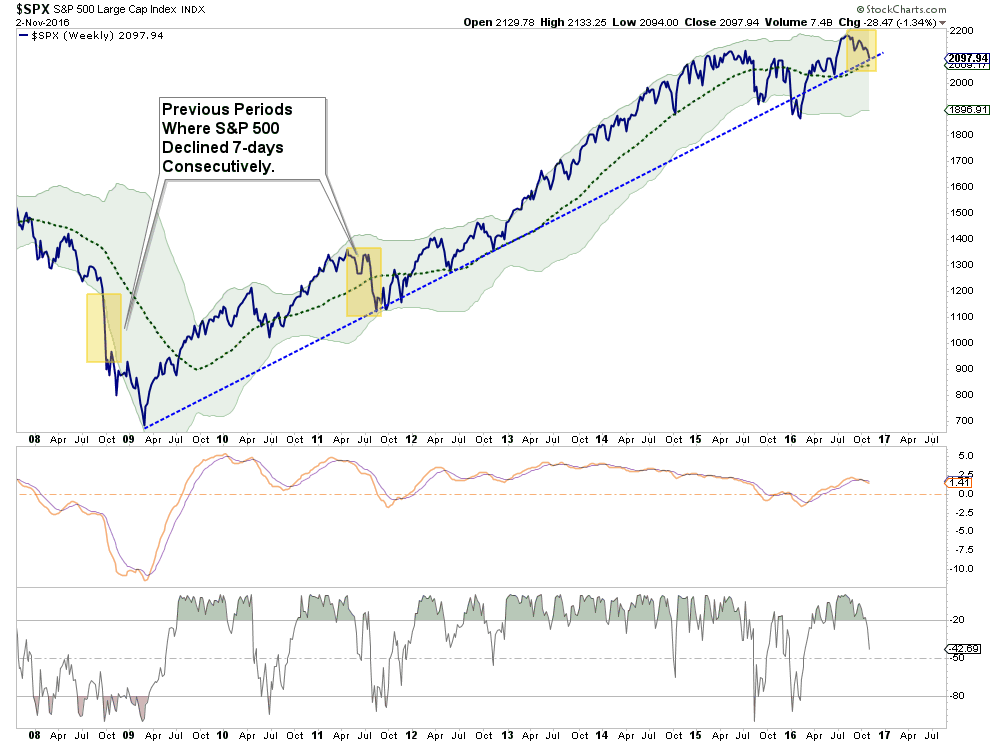
S&P Just Did Something Only Seen Three Times Previously
Bloomberg had a very interesting note out yesterday stating:
“Over the last 20 years, the S&P 500 index has only recorded a seven-day losing streak on three separate occasions. The first was in 2008 after Lehman Brothers collapsed, while the other two were during Europe’s 2011 debt crisis. If the index ends the day lower on Wednesday, it’ll chalk up a fourth.”
Well, it did.
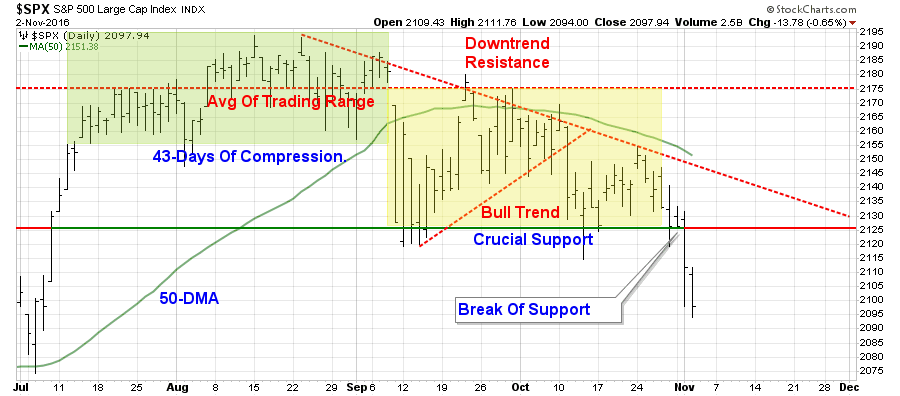
Importantly, as I addressed in the latest newsletter, the violation of that crucial support suggests a further correction is likely. However, by the time a break is completed, the market has already become short-term oversold and a “sellable bounce” is very likely. As Bloomberg noted:
“The index’s longest-ever run of losses was eight days, matched at the height of the financial crisis in October 2008. The S&P 500 started falling on Monday, September 29 and saw lower closes at the end of every trading day until October 10, in what was its worst week in history.”
But a bounce and a resumption of a bull-market are two different things. As was seen in both 2008 and 2011, the consecutive 7-day declines led to further selling before a bottom was eventually found.
Lance Roberts

Lance Roberts is a Chief Portfolio Strategist/Economist for Clarity Financial. He is also the host of “The Lance Roberts Show” and Chief Editor of the “Real Investment Advice” website and author of “Real Investment Daily” blog and “Real Investment Report“. Follow Lance on Facebook, Twitter and Linked-In