by Nick Kalivas, Senior Equity Product Strategist, Invesco Powershares, via S&P Dow Jones Indices
Rates, volatility and a broad market rally have contributed to the factor’s late-summer slump
Late summer has not been fruitful for the low volatility factor. From July 6 to Sept. 9, the S&P 500 Low Volatility Index has fallen by 4.67%, while the S&P 500 Index gained 1.70%.1 This is in sharp contrast to the second quarter, when the low volatility index returned 6.75%, and the broad-market index returned 2.46%.1 Naturally, some investors are wondering what’s behind the shift.
Looking at market conditions during this time, I see three headwinds that were working against the low volatility factor:
- Interest rates rose. The 10-year Treasury yield rose from 1.31% on July 6 to a close of 1.67% on Sept. 9.1
- Volatility was relatively flat. The CBOE Volatility Index (the VIX) was 14.96 on July 6 and was 12.51 on Sept. 8. before finishing at 17.5 on Sept. 9.1
- The S&P 500 Index rallied. While the index gave back much of its earlier gains on Sept. 9, it had rallied for most of July and August.
When has low volatility outperformed?
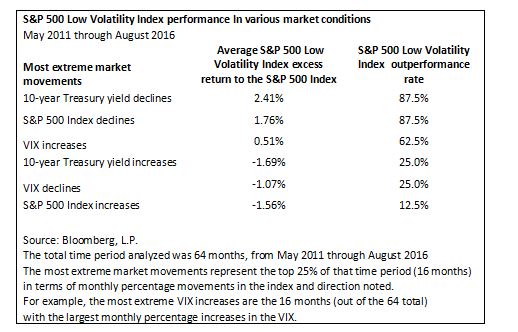
The low volatility factor has tended to shine when interest rates are flat to lower, stock prices are falling and volatility is rising. We can see this in the table below, which examines the performance of the S&P 500 Low Volatility Index during extreme moves in the S&P 500 Index, the VIX and 10-year Treasury yields from May 2011 through August 2016. In that time frame, there were 64 months of returns. The table examines low volatility performance during the most extreme months (the top 25%) in terms of the largest increases and decreases in each index.

Examining low volatility results
- By volatility. During the 16 months when the VIX had its largest percentage increases, the S&P 500 Low Volatility Index outperformed the S&P 500 Index 62.5% of the time, with an excess return of 51 basis points (bps). In contrast, during the 16 months when the VIX had its largest percentage drops, the low volatility index outperformed the broad market just 25% of the time, with an average lag of 107 bps.
- By rates. During the 16 months when the 10-year Treasury yield had its largest percentage increases, the S&P 500 Low Volatility Index outperformed the S&P 500 Index just 25% of the time, trailing by an average of 169 bps. During the top months of yield declines, the low volatility index outperformed the broad market 87.5% of the time, with an average excess return of 241 bps.
- By market performance. During the 16 months when the S&P 500 Index had its largest declines, the S&P 500 Low Volatility Index outperformed 87.5% of the time, with an average excess return of 176 bps. In contrast, during months when the S&P 500 Index gained the most, the low volatility index outperformed 12.5% of the time, with an average underperformance of 156 bps.
Bottom line: Low volatility is performing as expected|
When you look at the market conditions experienced in late summer, it’s no surprise that low volatility shares underperformed the broad market. This is by design. However, it’s important to remember that the low volatility factor does occasionally outperform in up markets and occasionally lag in down markets. And while higher rates and a lower VIX have been headwinds for low volatility, the results are not absolute. There are exceptions. Understanding market trends and the potential for exceptions can help investors set proper expectations for low volatility performance.
This article is a publication of S&P Dow Jones Indices LLC. © S&P Dow Jones Indices LLC 2016. S&P® is a registered trademark of S&P Financial Services LLC. Dow Jones® is a registered trademark of Dow Jones Trademark Holdings LLC. S&P Dow Jones Indices LLC is not an investment advisor. This publication is not a recommendation by S&P Dow Jones Indices to buy, sell, or hold a security, nor is it considered to be investment advice.
Copyright © S&P Dow Jones Indices


