This week in the SIA Equity Leaders Weekly, we are going to analyze the Mexican Peso vs the US Dollar and take a look into how US politics may be affecting this relationship. Second, we will look at the Internet sector as its continues to strengthen and what may be driving some of the returns in the sector.
Mexican Peso/US Dollar (MXNUSD)
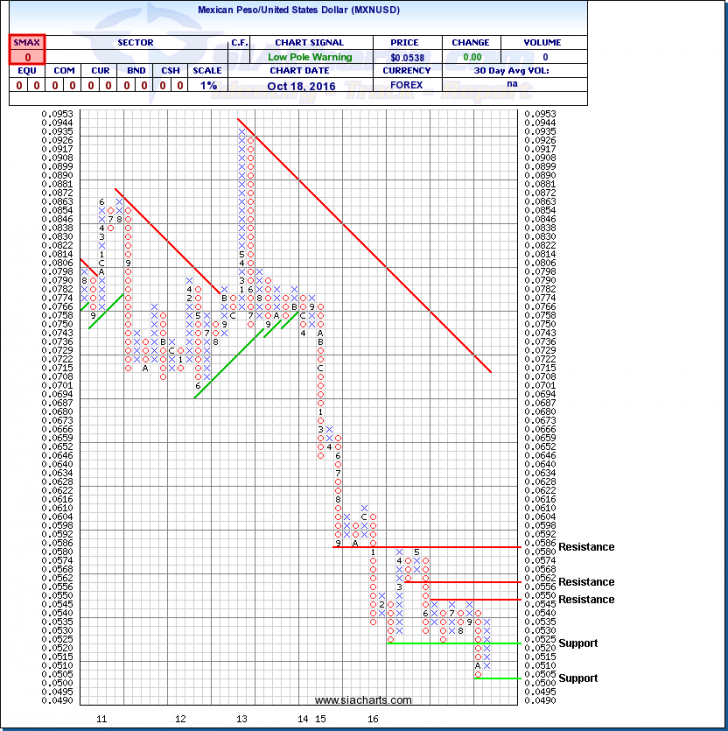
The MXNUSD currency pair has become an interesting metric to follow over the past several months. Some have noted that if you want to know how the US Presidential Election is going you can forget about the opinion polls, just take a look at the Mexican Peso. The currency has been moving inversely with the likelihood of a Donald Trump Presidency as one Credit Suisse analyst traced the link back to early May when rival Ted Cruz dropped out of the race when the peso sold off while other emerging market currencies were relatively unchanged. This movement in the currency suggests that the Republican nominee’s protectionist policies could have a negative impact on trade prospects with Mexico and therefore could bring down the currency.
In looking at the chart, we can see the MXNUSD bounced off of all time lows earlier this month around $0.0500 and has been in a steady column of X’s now approaching resistance at $0.0550. The peso has failed to move through $0.0550 on its last three attempts, but a move through this could signal further strength to the next resistance at $0.0562 then above that at $0.0586 - levels not seen since 2015. To the downside we can see support for MXNUSD at $ 0.0520 and below at $0.0500. Going forward, look to see whether the Peso continues its move through resistance or if it will remain consolidated within these support and resistance levels. With an SMAX of 0 out of 10 MXNUSD is showing no signs of short term relative strength versus the asset classes.
It will be interesting to see how this currency pair continues to trade and if it will continue its inverse relationship to US politics. Further to the MXN/USD, interest rate policy can also be a factor that could affect this relationship. As the election winds down over the next few weeks, look for breakouts of key support and resistance levels for further guidance on this currency pair.
Click on Image to Enlarge

NASDAQ Internet Index
To take a look at the Internet sector, we will take a look at the NASDAQ Internet Index using the PowerShares NASDAQ Internet Portfolio ETF (PNQI). The NASDAQ Internet Index is designed to track the performance of the largest and most liquid US-listed companies engaged in internet-related businesses and that are listed on one of the major US stock exchanges. Major holdings within the Nasdaq Internet Sector are what some refer to as F.A.N.G. which is made up of Facebook Cp (FB), Amazon.com Inc (AMZN), Netflix Inc (NFLX), and Alphabet Inc (GOOGL) all of which are ranking highly in their respective SIA Reports. Yesterday, after earnings announcement, Netflix went on to have almost a +20% after beating analyst estimates.
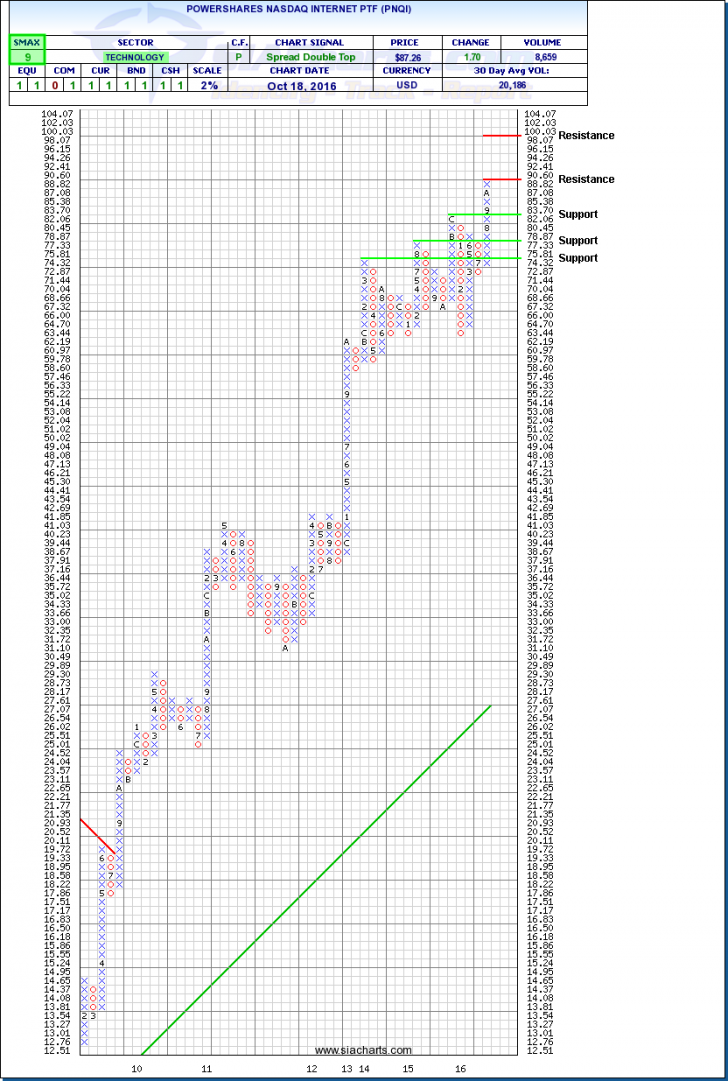
The internet ETF, PNQI, continues to push to all time highs after posting three months of positive gains. Approaching resistance at $90, a move through this could see further resistance come into play at $100. Downside support can be found at prior resistance levels of $82.06, $77.03 and $74.32. The sector continues to press on in its long term uptrend as viewed by the chart, however this ETF also looks to be susceptible to strong pull backs having long columns of X’s followed by also long columns of O’s. The whole story cannot be understood just by looking at one chart which is why we analyze relative strength of securities compared to other securities to know when there are times to be in and times to be out of certain positions. PNQI currently sits in the #11 spot out of 225 in the SIA US Equity Specialty Report where the longer term relative strength outlook for the sector remains strong. With an SMAX score of 9 out of 10, PNQI is also exhibiting near term strength versus the asset classes.
Click on Image to Enlarge

SIACharts.com specifically represents that it does not give investment advice or advocate the purchase or sale of any security or investment. None of the information contained in this website or document constitutes an offer to sell or the solicitation of an offer to buy any security or other investment or an offer to provide investment services of any kind. Neither SIACharts.com (FundCharts Inc.) nor its third party content providers shall be liable for any errors, inaccuracies or delays in content, or for any actions taken in reliance thereon.
For a more in-depth analysis on the relative strength of the equity markets, bonds, commodities, currencies, etc. or for more information on SIACharts.com, you can contact our customer support at 1-877-668-1332 or at siateam@siacharts.com.
Copyright © SIACharts.com


