by LPL Research
“October: This is one of the peculiarly dangerous months to speculate in stocks. The others are July, January, September, April, November, May, March, June, December, August and February.” –Mark Twain
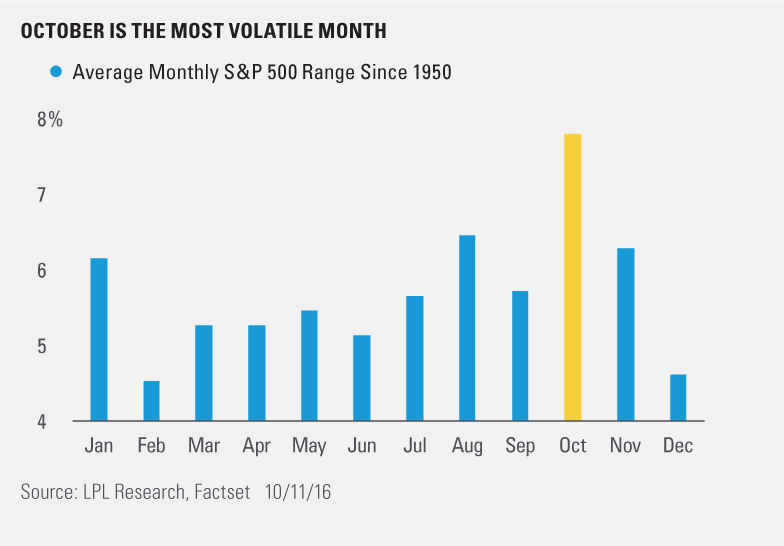
As the famous market quote by Mark Twain suggests, October has long had a history as a potentially troubling time for stocks. After yesterday’s 1.2% drop on the S&P 500, it is a strong reminder that October is one of the most volatile months of the year. Now, we’d like to note that we do not advise speculating in stocks as the quote above suggests, instead taking a long-term view to creating wealth. History has shown that the path of stocks over time has been up; in other words, the dips were usually opportunities, not times to panic.
According to Senior Market Strategist Ryan Detrick, “October has a reputation as a month you better buckle your seatbelts for a reason. Nearly all the volatility records seem to take place during this month.” As we noted in “Welcome to the Fourth Quarter,” October is a near the middle of the pack month in terms of average monthly return going back to 1950 – while it is actually the best performing month over the past 20 years.
What else about this month makes it stand out?
- Over the past 20 years the best performing month was October 2011 at up 10.8%, while the worst month was October 2008 at down 16.9%.
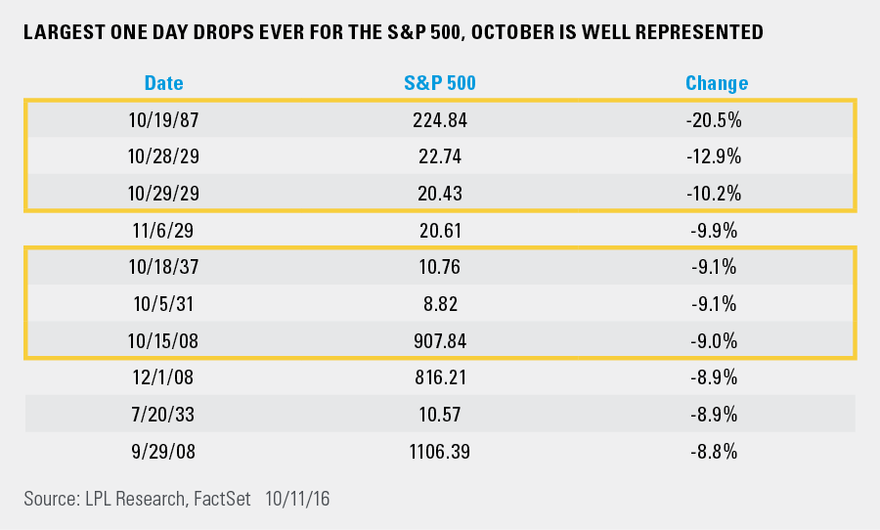
- The single worst day ever for the S&P 500 was Black Monday on October 19, 1987 when it dropped 20.5%. Incredibly, six of the 10 largest one day drops (back to 1928) took place in this month.
- The largest one-day gains for the S&P 500 since 1950 both took place during October 2008, when it gained 11.6% and 10.8% on the 13th and 28th, respectively. This makes the fact that October 2008 lost 16.9% all the more amazing.
- Since 1950, the single best month was a 16.3% gain during October 1974, while the 22.8% drop in October 1987 is the worst.
- As we noted at the start of the month, no month has a wider range (from high to low) over the course of the month than October.
- Since 1928, 246 days during the month of October have lost at least 1%—the most out of any month. Meanwhile, a day gained 1% or more 289 times during October—again the most for any month. In aggregate, 27.7% of all days in October have closed up or down at least 1%, the most for any month with November coming in second at 27.1%.
- Looking at some of the largest reversals off the intra-day lows, only 10 times has the S&P 500 been down three percent at one point during the day and closed green. Four of those times took place in October.
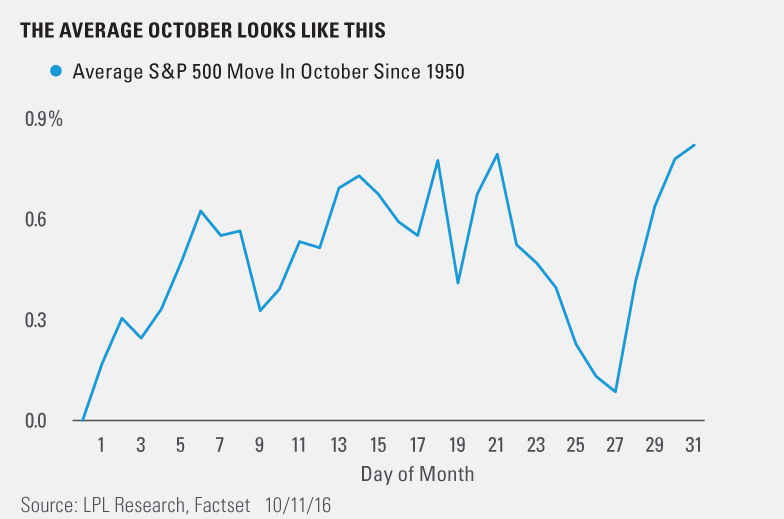
- Lastly, October tends to see weakness late in the month, but a big bounce into Halloween.
As we noted in our Midyear Outlook, we expect the rest of the year to remain volatile and with the election right around the corner and earnings season heating up, October could once again provide some fireworks.


