
by James Picerno, The Capital Spectator
Equal weighting has an encouraging record as a design choice for earning a moderately higher premium in the stock market compared with the conventional weighting system of holding shares in proportion to their market-capitalization weight. A leading real-world example: the Guggenheim S&P 500 Equal Weight ETF (RSP) has earned a 7.9% annualized total return for the past 10 years through Oct. 10. That’s a handsome edge over a standard market-cap-weighted S&P fund: the SPDR S&P 500 (SPY) earned a moderately lower 7.0% over the same period, according to Morningstar.com. Does equal weighting also lift asset allocation results over a conventional portfolio design?
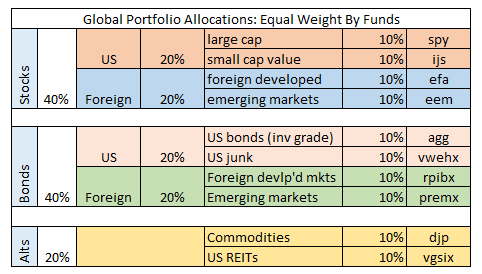
As a preliminary test, let’s consider how a portfolio of ten funds spanning global stocks and bonds, plus REITs and commodities, fares with a plain-vanilla strategic weighting (SW) vs. equal weighting (EW). Here’s the profile for the SW mix:

Note that the SW design is inspired by a global 60% stock/40% allocation and tweaking the design by taking five percentage points from each side and reallocating to 5% REITs and 5% commodities–a 10% weight in so-called alternative assets overall.
Next, here’s the EW portfolio, which holds equal weights in each of the same ten funds.
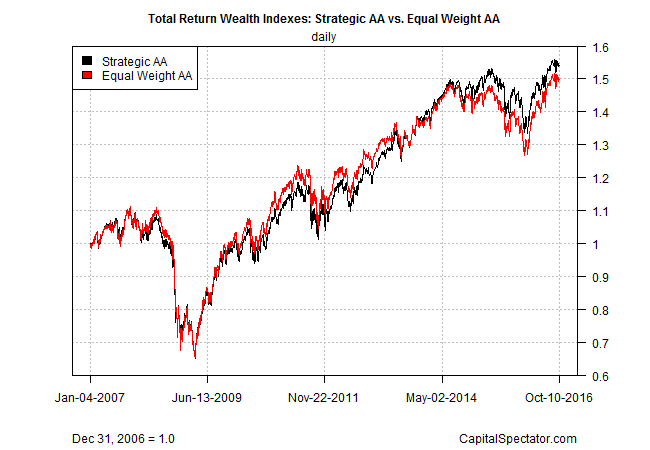
The start date for the test is the close of 2006. Both portfolios are rebalanced to target weights once a year–every Dec. 31. The analysis uses daily data.
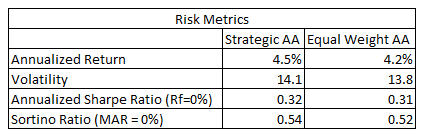
The main result is that the two portfolios deliver similar returns over the test period, albeit with a slight edge for SW, which earned an annualized 4.5% vs. 4.2% over the equal-weighted mix.
The risk profiles look comparable as well. For instance, the SW’s Sharpe ratio of 0.32 is virtually identical to EW’s 0.31.
The worst drawdowns are equivalent for SW and EW, each sliding by 41% from their respective peaks during the 2008-2009 financial crisis. Note, however, that SW’s deepest drawdown was a bit longer: 799 days vs. 740 for EW.
The question is whether this test is robust for analyzing equal weighting in an asset allocation framework? The answer isn’t obvious because it’s not clear that the asset allocation design is optimal. As such, we’re left with more questions than answers at this point in the analysis. Is EW’s slightly lower return due to the use of an annual frequency for rebalancing? Would a monthly or quarterly schedule deliver stronger or weaker results?
Or is the problem for EW related to the choice of funds/asset classes in the tables above? As an alternative, we can break out the fund choices into a more granular lineup. US equities, for instance, could be populated with funds that target a variety of market caps or sectors.
But we should be mindful that there are constraints for designing an equal-weight portfolio. The main challenge: selecting funds that won’t introduce an unintended bias into the asset allocation’s risk profile. If we have more bond funds than stock funds, equally weighting the mix will result in a heavier weight for fixed income. In other words, our choices are limited for breaking the asset mix into smaller pieces when the guiding principle is equal weighting. By comparison, there’s greater flexibility with a market-cap framework. Ditto for an actively managed asset allocation strategy.
Nonetheless, the research on equal weighting implies that superior results are possible if not inevitable. That’s certainly appears to be true in the equity space. It may be true for designing and managing asset allocation, although a deeper level of testing is required.
But let’s recognize that while the analysis above doesn’t hit a home run for equal weighting, it doesn’t strike out either. The fact that the EW design has more or less matched SW’s results implies that a bit of tweaking could deliver even stronger risk-adjusted returns. Then again, maybe equal weighting doesn’t lend itself to asset allocation. The analysis above isn’t decisive either way.
Copyright © The Capital Spectator