by LPL Research
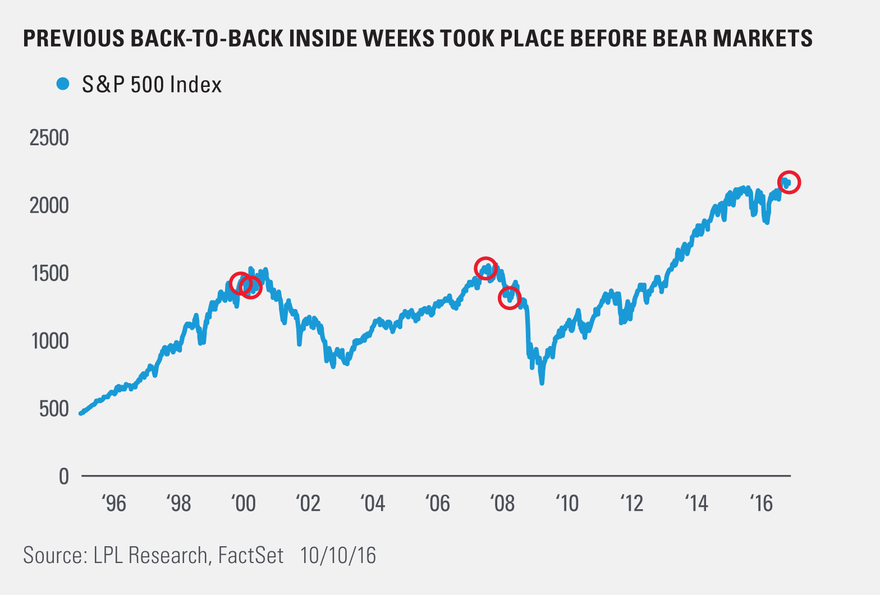
A rather rare event took place on the S&P 500 recently, as the index had back-to-back “inside weeks.” An inside week is when the range (from high to low) on the week fits inside the range of the previous week – thus the name. These are considered a consolidation phase that could potentially be followed by a big move. Back-to-back inside weeks are rare, with the most recent occurrences being February 2008, June 2007, January 2000, and December 1999. Here’s the chart.
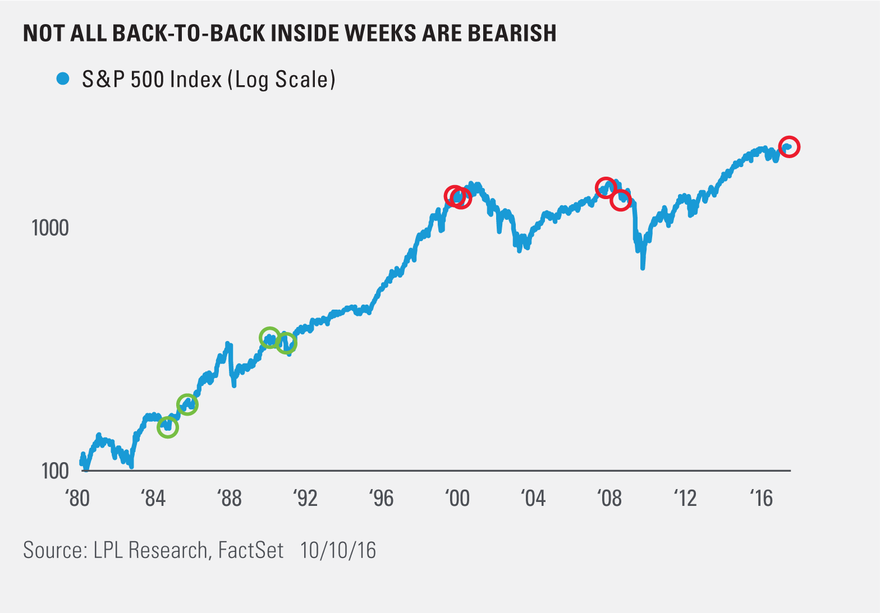
As you might expect, this rare event has many wondering if this latest signal could be a warning sign of an impending bear market. The chart above has been shared all over social media and is stirring up a good deal of conversation. Here’s the catch, if you go back further in time, things look a little bit different.
Going back to 1980, the other times the S&P 500 saw back-to-back inside weeks were September 1990, October 1989, September 1985, and July 1984. The returns after were fairly strong, as the S&P 500 gained 26.5% a year after the ’84 signal, 33% after the ’85 signal, and 20% after the late ’90 signal. The ’89 signal did see the S&P 500 pull back nearly 20% from its all-time high over the coming year, as a recession and war in Iraq led to equity weakness.
Our stance is that using just one infrequent signal to make a major call is a foolish game. Charts like the first one in this blog are very popular and gain a good deal of attention, but we prefer to take a much wider look at things. As we noted in Five Forecasters: Few Warning Signs, we see many more signs of strength than weakness in the economy and stock market. The Five Forecasters are five indicators that, collectively, have historically signaled increasing fragility of the U.S. economy and a transition to the late stage of the economic cycle, with increased potential of an oncoming recession.
Here’s how we summed up the Five Forecasters:
The Five Forecasters are signaling economic growth and the continuation of the bull market. The yield curve and Conference Board Leading Economic Index (LEI) are sending positive signals, while market breadth offers confirmation of the bull market. Two indicators, the price-to-earnings ratio (PE) and the ISM Manufacturing Index, are flashing some warning signs, but we believe these five indicators, collectively, are signaling a mid-to-late cycle economy and continuation of the seven-and-a-half year old bull market. We may see a pickup in stock market volatility and returns may be modest over the next year or two, but our favorite leading indicators and our general assessment of the macroeconomic backdrop suggest more gains for stocks may potentially lie ahead.
IMPORTANT DISCLOSURES
Indices are unmanaged and cannot be invested into directly. Unmanaged index returns do not reflect fees, expenses, or sales charges. Index performance is not indicative of the performance of any investment. Past performance is no guarantee of future results.”
The opinions voiced in this material are for general information only and are not intended to provide or be construed as providing specific investment advice or recommendations for any individual security.
Investing in stock includes numerous specific risks including: the fluctuation of dividend, loss of principal and potential illiquidity of the investment in a falling market.
The economic forecasts set forth in the presentation may not develop as predicted.
A leading indicator is an economic indicator that changes before the economy has changed. Examples of leading indicators include production workweek, building permits, unemployment insurance claims, money supply, inventory changes, and stock prices. The Fed watches many of these indicators as it decides what to do about interest rates.
The P/E ratio (price-to-earnings ratio) is a measure of the price paid for a share relative to the annual net income or profit earned by the firm per share. It is a financial ratio used for valuation: a higher P/E ratio means that investors are paying more for each unit of net income, so the stock is more expensive compared to one with lower P/E ratio.”
The U.S. Institute for Supply Managers (ISM) manufacturing index is an economic indicator derived from monthly surveys of private sector companies, and is intended to show the economic health of the U.S. manufacturing sector. A PMI of more than 50 indicates expansion in the manufacturing sector, a reading below 50 indicates contraction, and a reading of 50 indicates no change.”
The S&P 500 Index is a capitalization-weighted index of 500 stocks designed to measure performance of the broad domestic economy through changes in the aggregate market value of 500 stocks representing all major industries.
This research material has been prepared by LPL Financial LLC.
To the extent you are receiving investment advice from a separately registered independent investment advisor, please note that LPL Financial LLC is not an affiliate of and makes no representation with respect to such entity.
Not FDIC/NCUA Insured | Not Bank/Credit Union Guaranteed | May Lose Value | Not Guaranteed by any Government Agency | Not a Bank/Credit Union Deposit
Securities and Advisory services offered through LPL Financial LLC, a Registered Investment Advisor Member FINRA/SIPC
Tracking # 1-544153 (Exp. 10/17)
Copyright © LPL Research


