by Lance Roberts, Clarity Financial
Are Auto Sales Really All That Strong?
The media was especially excited yesterday regarding the release of the auto sales data. To wit:
“US auto sales were higher than expected in September after automakers offered a record amount in incentives to buyers.
According to Autodata, sales reached a seasonally adjusted annual rate of 17.76 million. Analysts had forecast a rate of 17.45 million, according to Bloomberg.”
However, despite the bullish headlines, below the surface were some troubling statistics. Let’s look at the data.
Let’s set aside for the moment cars are being financed in progressively worse manners as sub-prime credit, lease terms and length of contracts continue to soar. Dealers have resorted to loans as long as 8-years in order to get payment terms to levels that sub-prime borrowers can afford. This potentially has a very negative side-effect on future auto sales as consumers are locked into eroding cars with negative equity and an inability to trade in. But that is a story for the next economic recovery cycle.
For now, however, the tools currently being used to move auto inventory may have run their course as incentives supplied by dealers are being stretched as well averaging $3,923 per vehicle. We saw similar gimmicks used to seduce buyers during the last two peaks in sales as well. Do you remember “Get the ’employee discount’ pricing deal?”
The reported rate of 17.6 million automobiles sold is roughly the same as it has been over the last several months. That alone should be a sign of caution and suggestive that sales may be reaching a plateau. More importantly, it is also important to remember this is an annualized number. In reality, only 1.46 million were actually sold, but still a large number.
To smooth out any “seasonal adjustment” bias, I have taken the non-seasonally adjusted sales and smoothed it with a 12-month average. I then overlaid the reported “seasonal adjusted” sales and calculated the differential between the two numbers.
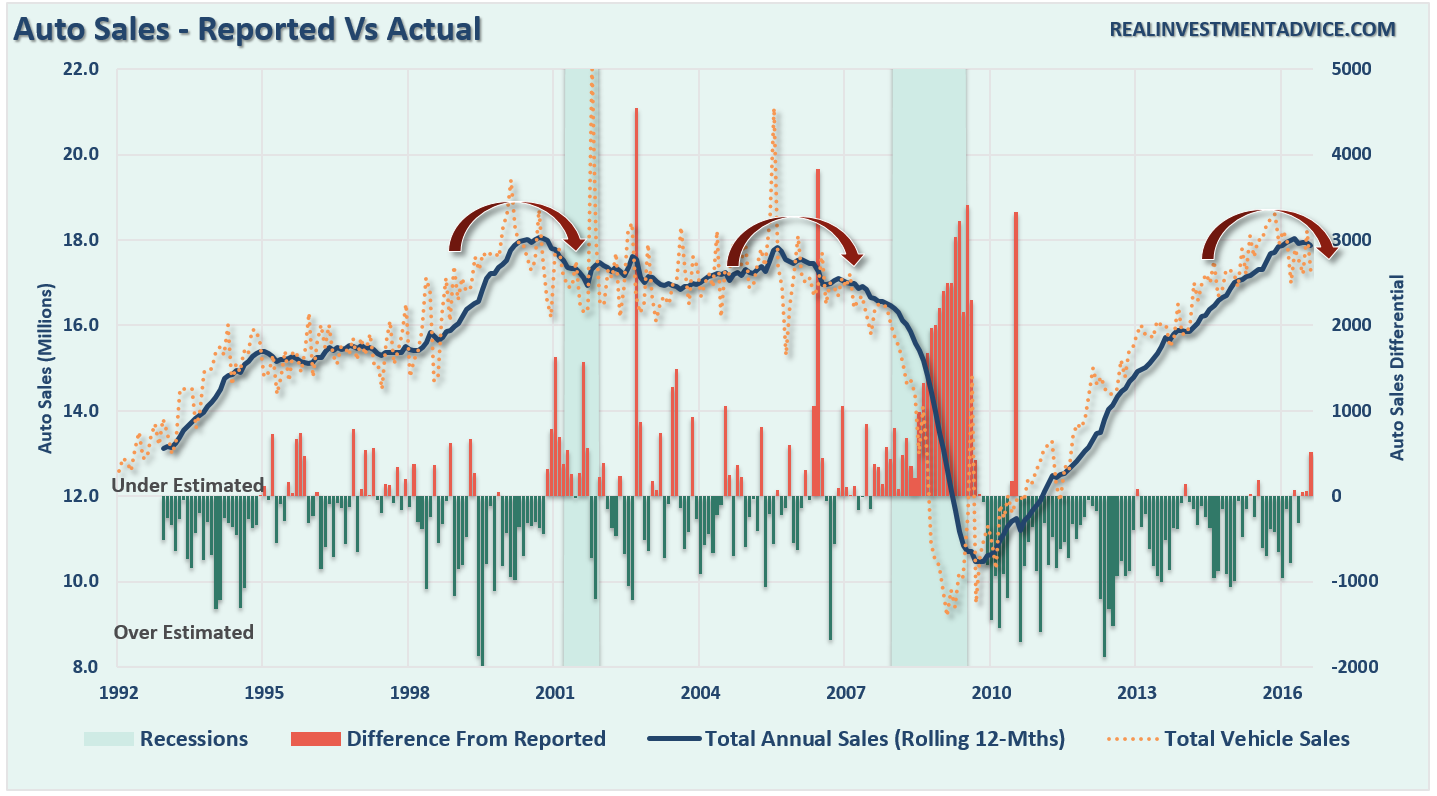
As shown, the reports tend to substantially OVER estimate sales during growth cycles and UNDER estimate during recessions. Importantly, notice that in the most recent reporting period, sales are currently running at levels that have been historically unsustainable.
The problem with general media commentary and analysis is the focus on a “single” data point rather than the “trend” of the series. The chart below shows us two important points.
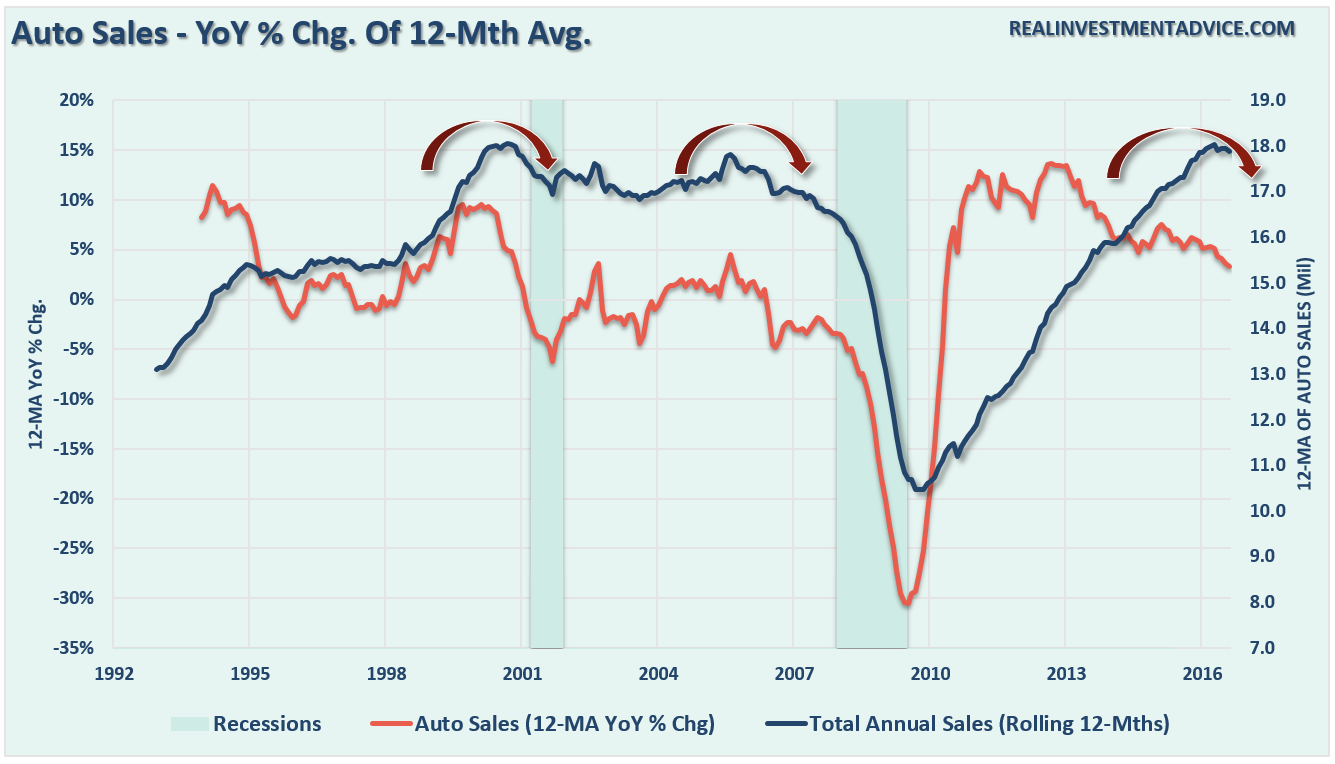
The first is that while the “annualized” reported sales number was near the highest in 10-years, the historical average of cars sold is still at levels below both previous peaks.
Secondly, and more importantly, is both previous peaks in total auto sales were preceded by a decline in the annual percentage change of cars sold. Since 2013, the rate of change in auto sales has declined markedly even as inventories continue to build. This explains the push for dealer incentives, subprime credit loans, longer loan terms, and special lease provisions to continue to push inventory out.
Lastly, all of this data suggests that the auto sales cycle is very long in the tooth and the economy is likely weaker than the latest “annualized” run of auto sales suggests. As we saw at both previous peaks in auto sales, the push to sell autos at “any cost” has generally ended poorly.
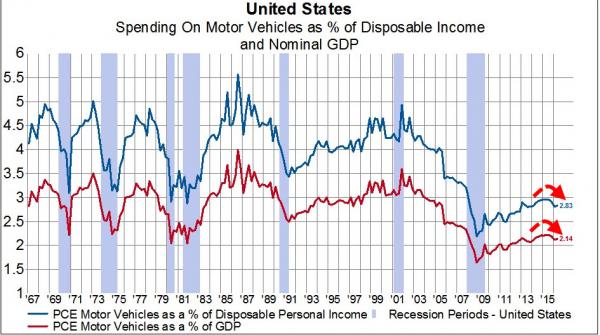
But this chart from Eric Bush via GaveKal really sums it up best – the recovery wasn’t as good as advertised and it appears to be ending.
What’s Up? Oil Prices
Besides interest rates, I also cover oil and energy prices on a regular basis in the weekly e-newsletter. At the beginning of September I wrote:
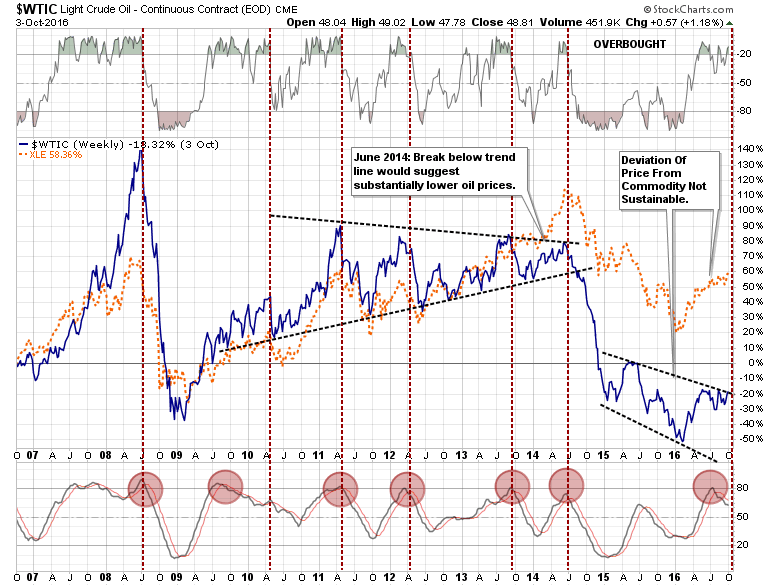
“In July I suggested, as shown in the longer term oil chart below, there was little to suggest a recovery back to old levels in oil prices anytime soon. With oil prices back to extreme overbought conditions, a retracement to $35 or $40/bbl would not be surprising particularly if, and when, the US Dollar strengthens.”
That call was quite prescient as declined almost back to $40/bbl shortly after that writing. However, not only did we retrace back to almost $40 once, but twice. With oil prices now back at extreme overbought levels (green dots on top), a triggering of a longer term sell signal will likely see a push back towards the $35-40/bbl range. Importantly, with oil prices below the downtrend line, the pressure currently remains to the downside.

However, the recent push higher in oil prices, due to the announcement that OPEC might possibly, maybe, hopefully, cap output at August record levels has gotten commodity traders excited, or rather, scared the bejeebers out of the oil shorts.
The reality is the “deal” was nothing more than an agreement to maybe, possibly, hopefully, consider talking about a potential agreement in November. The “deal” will very likely fall apart well before then.
The chart below shows the previous high correlation, as would be expected, between energy stocks and oil prices. The divergence in early 2014 is what prompted my call back then to begin reducing exposure to energy stocks. Importantly, the deviation between oil prices and energy-related investments is expanding once again as individuals chase stocks at a time when prices are well detached from underlying fundamentals. Hindsight bias, which is buying something based on past performance hoping it will repeat, is a very dangerous method of investing.
There is still a significant amount of unwinding left in the energy space as production is still far outstripping demand. If the collapse in China continues, or when the U.S. economy slips into the next recession, it is likely that oil prices will drop back into the low $30’s which will put additional pressure on energy company related earnings.
Furthermore, exuberance is still high. Great buying opportunities come when the markets become convinced that oil prices and energy companies are “eternally dead.” We are not there just yet.
Technicals Suggest A Nasdaq Redux
There has been quite a lot of discussion in the past year about the strength of Technology stocks and the return to “Nasdaq 5000.” Of course, such lofty heights also bring out the arguments over various valuation metrics and whether, or not, this is the next “dot.com” bubble.
Yes, for sure, “this time is different” than 2000 as many of the companies leading the technology charge actually do make money. However, while making money is important, it does not nullify the aspects of exuberant price movements and momentum chasing.
First, let’s take a look at the current valuations of the big-5 technology stocks: GOOG, AAPL, NFLX, FB, and AMZN.

(Note: In order for a company to maintain a Price / Sales ratio of 2.0 it must grow sales at roughly 20% every year indefinitely to maintain that ratio with a respective price increase. In other words, it is very difficult for a company to consistently grow sales at that pace.)
With the exception of AAPL, there is little argument that technology overall is pushing the upper limits of valuations. But, for the sake of argument, let’s set aside the fundamental arguments for a moment and focus on the technical backdrop.
First, as shown below, the current price consolidation, as I discussed with respect to the S&P 500 on Tuesday, is quickly reaching a decision point. A break to the upside should see a rather sharp advance into the end of the year while a break to the downside would produce a relative decline.

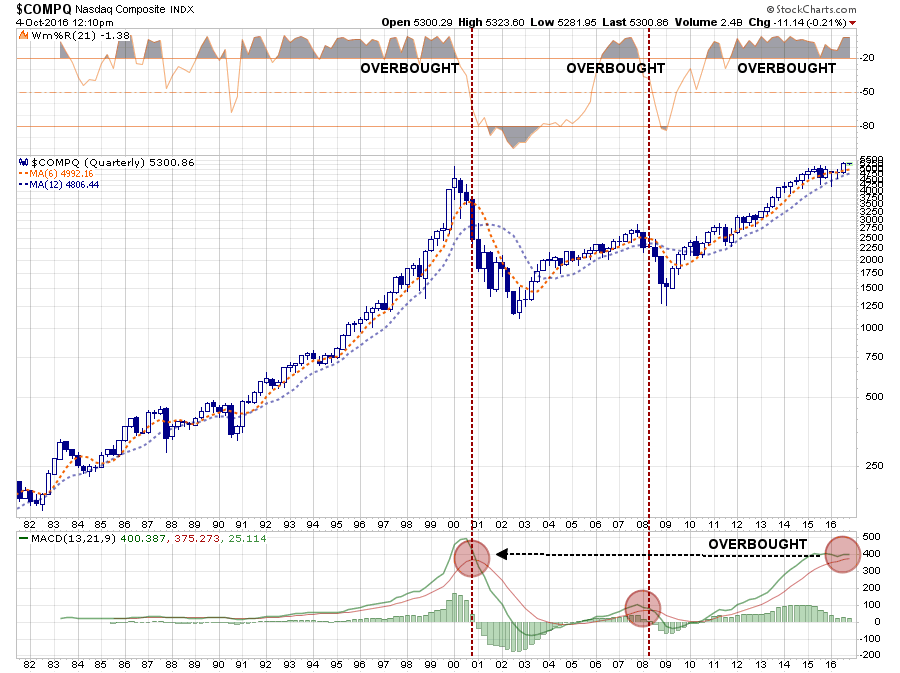
Secondly, it is the long-term monthly chart that is most interesting. While market participants are once again chasing technology stocks with reckless abandon, because “this time is different”, the reality is it is likely not.
Given the current extreme overbought conditions of the market on a monthly basis, combined with a potential “sell signal” from similarly high levels, the previous declines have been devastating.
While I am NOT suggesting that you should run out and sell all of your technology holdings tomorrow, the belief that somehow, this time, will be different than the last is likely misguided.
As always, when the eventual selling begins, it will be indiscriminate. Given the massive rise in all asset prices over the last eight years, the extensions well above historical norms and valuations that are hard to rationally justify, the unwinding will likely be just as brutal as the last.
Lance Roberts

Lance Roberts is a Chief Portfolio Strategist/Economist for Clarity Financial. He is also the host of “The Lance Roberts Show” and Chief Editor of the “Real Investment Advice” website and author of “Real Investment Daily” blog and “Real Investment Report“. Follow Lance on Facebook, Twitter and Linked-In