by John Canally, Chief Economic Strategist, LPL Financial
KEY TAKEAWAYS
· This year’s presidential campaign marks a sea change in how our nation views foreign trade.
· The benefits and costs of trading relationships are complex; a rising tide does not lift all boats equally, and may not raise some boats at all.
· U.S. regions vary in what they export and to which countries; this may influence their view of the benefits and costs of trade.
As the election nears, we see how rules on international trade, and globalization as a concept, have impacted American politics. There have always been skeptics on trade from both the traditional “right” and “left” of the political spectrum. That skepticism has become the dominant view of trade, expressed by both presidential candidates. Imports and exports may act at cross purposes on the national account statement, but their impact in the real economy is much more complex. The types of goods the United States imports and exports vary greatly, and each type of good has a different workforce base that creates them. Different regions in the U.S. specialize in exporting different goods, and these differences create relative “winners” and “losers” from global trade. It’s also true that we tend to import and export from the same countries; even countries with which we have large trade deficits are the destination for many exports.
Trading one consensus for another
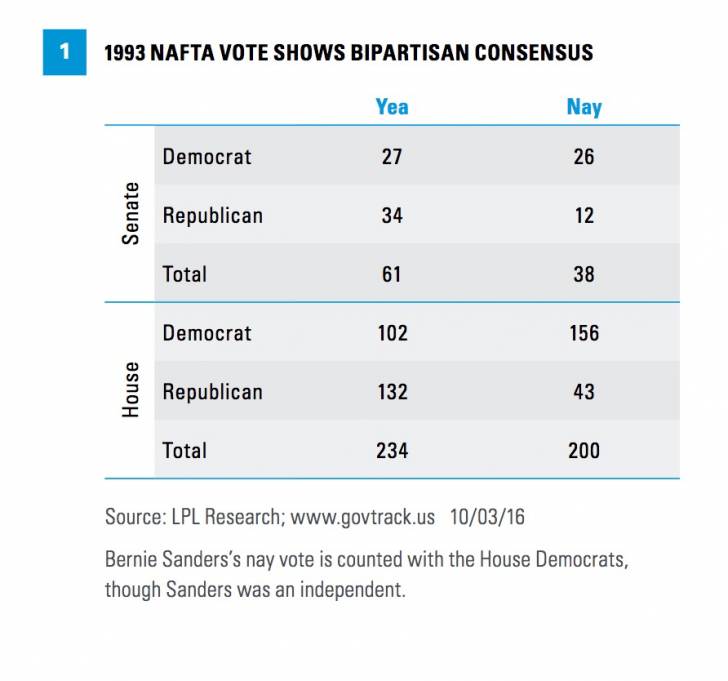
Support for global trade, including the agreements that lower tariffs in order to facilitate trade, has long been the bipartisan consensus in the U.S. There have always been skeptics on trade within both political parties, but the political center has firmly been in the “pro-trade” camp. The November 1993 vote on the North American Free Trade Agreement (NAFTA) shows this consensus [Figure 1]. Very recently, this favorable orientation to trade has reversed. Donald Trump made opposition to trade the hallmark of his campaign to win the Republican nomination, whereas many of his initial rivals had more conventional views on trade. Bernie Sanders voted against NAFTA and pushed Hillary Clinton further into the anti-trade camp; though Clinton can be considered a trade skeptic since her 2005 vote against expanding NAFTA. As recently as June 2015, the Senate voted 60–38 to grant President Obama “fast track authority” to speed negotiation of the Trans-Pacific Partnership (TPP), a trade deal that would lower tariffs and other barriers to trade with nations on the Pacific Rim. Though the TPP deal was finished in February 2016, it will not be voted on during this congressional session; its fate will be determined by, and after, the election. Regardless of who wins, and not just the presidency but in Congress as well, the TPP seems highly unlikely to be approved. In less than 18 months, Washington’s view of trade has completely reversed.
Trade varies by sector
We often read about the large, and at times growing “current account deficit,” the difference between the values of the goods and services we import versus those that we export. This difference is often referred to as the trade deficit; though to be technical, the term “trade deficit” only refers to trade in goods, where “current account deficit” refers to trade in goods and services. These deficits need to be financed, and they are viewed as a loss of national wealth. U.S. trade is complicated [Figure 2]. We trade in some goods that are in the same economic sector, but we also trade goods with very different impacts in our economy. For example, the U.S. is basically neutral on agriculture. What we import and export can be largely explained by geography and climate. We don’t grow coffee in the U.S., nor do we grow the full array of fruits and vegetables that we desire regardless of the time of year. But we do grow grains (wheat and corn) and soybeans, much of which is exported. Ceasing to import agricultural goods, such as coffee, may improve our trade deficit, but it will not benefit our economy, as it’s not likely, and probably not possible, to grow coffee commercially domestically.
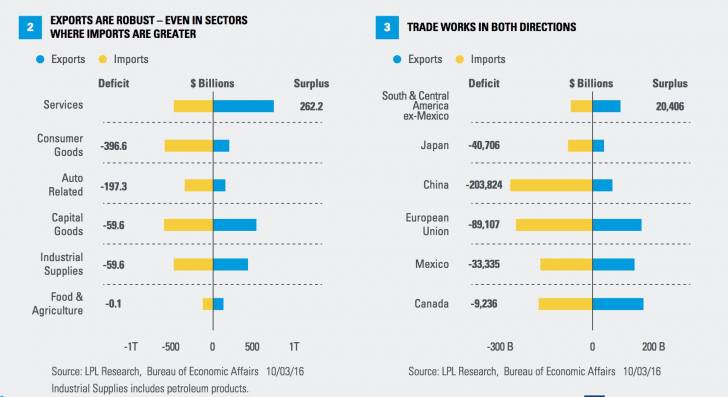
We see a very different pattern in areas like consumer goods, where the U.S. runs a large trade deficit. Two of the bigger components of U.S. consumer goods imports are apparel and toys, roughly $60 billion of imports in 2015. There are some exports in these areas, but they amount to less than $10 billion. U.S. production of these types of goods, typically low value added, has been in decline for years. Workers in these industries and the locations in which they had been concentrated (predominantly the Southeast) have suffered.
The largest categories of goods are capital goods, items that are not consumed directly but used by industry, often in the creation of other goods. One of the largest sectors for exports is related to civilian airplanes, totaling approximately $69 billion. Imports in this sector run about $21 billion. So aircraft is clearly an area where the U.S. is “winning” on global trade. The U.S. still runs a trade deficit in capital goods, with areas like telecommunications equipment, semiconductors, and other electronics items as examples where imports exceed exports, and therefore, drive up the trade deficit.
The data tell us that trade is not uniform. Some sectors of the economy have benefited from trade, whereas others clearly have been hurt by foreign competition. Though this commentary deals primarily with trade in goods, Figure 2 also highlights that the U.S. runs a substantial trade surplus for services. We wrote more extensively on trade in services in the Weekly Economic Commentary, “Checking in On Trade.”
What to where?
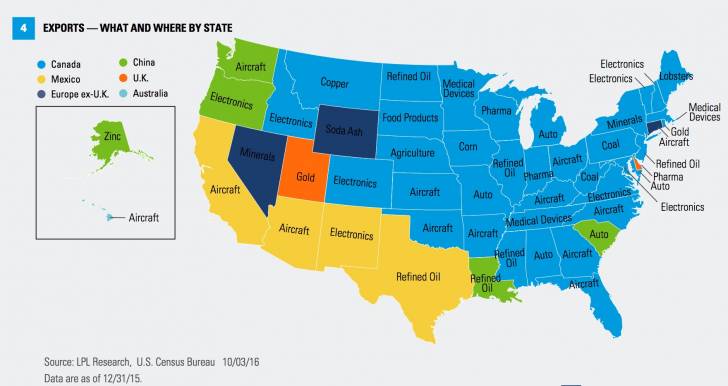
Even countries with which the U.S. has a trade deficit, like China, still may be the recipients of substantial exports [Figure 3]. So any change to trading relationships will have both positive and negative impacts on the domestic economy and on sectors and regions that are more export reliant. To illustrate this, Figure 4 shows the primary export, and the primary export destination, for each state. There are some things that surprised us. We noted the importance of aircraft-related exports to the U.S. economy as a whole. The map shows how important aircraft is for many areas in the country, not just for the West Coast, which has historically been the home for aircraft manufacturing. Also note the traditional industries in the Southeast, like furniture and textiles, are now dominated by the aircraft and automotive industries, at least in terms of exports. Not surprisingly, traditional energy-producing regions in the central South have petroleum-based products as their leading exports. These exports have been refined products, like gasoline, and not crude oil itself, which has only recently become legal to export. We would expect that as crude oil and natural gas exports increase, this will increase the importance of these materials to this region.
Conclusion
Trade is a hot button issue, politically and emotionally, for many people. Where people live, and what industries they are connected to, will likely go a long way in determining their views of the benefits and costs of trade. It is important to remember the issue is not monolithic: trade has very different sectors that can change its regional, state, or even local impact. Regardless, the political consensus has become more skeptical, if not hostile, to trade deals, which is a rapid and significant change in the country’s direction.
***
IMPORTANT DISCLOSURES
The opinions voiced in this material are for general information only and are not intended to provide specific advice or recommendations for any individual. To determine which investment(s) may be appropriate for you, consult your financial advisor prior to investing. All performance referenced is historical and is no guarantee of future results.
Any economic forecasts set forth in the presentation may not develop as predicted and there can be no guarantee that strategies promoted will be successful.
Investing in stock includes numerous specific risks including: the fluctuation of dividend, loss of principal and potential illiquidity of the investment in a falling market.
Copyright © LPL Financial


