by LPL Research
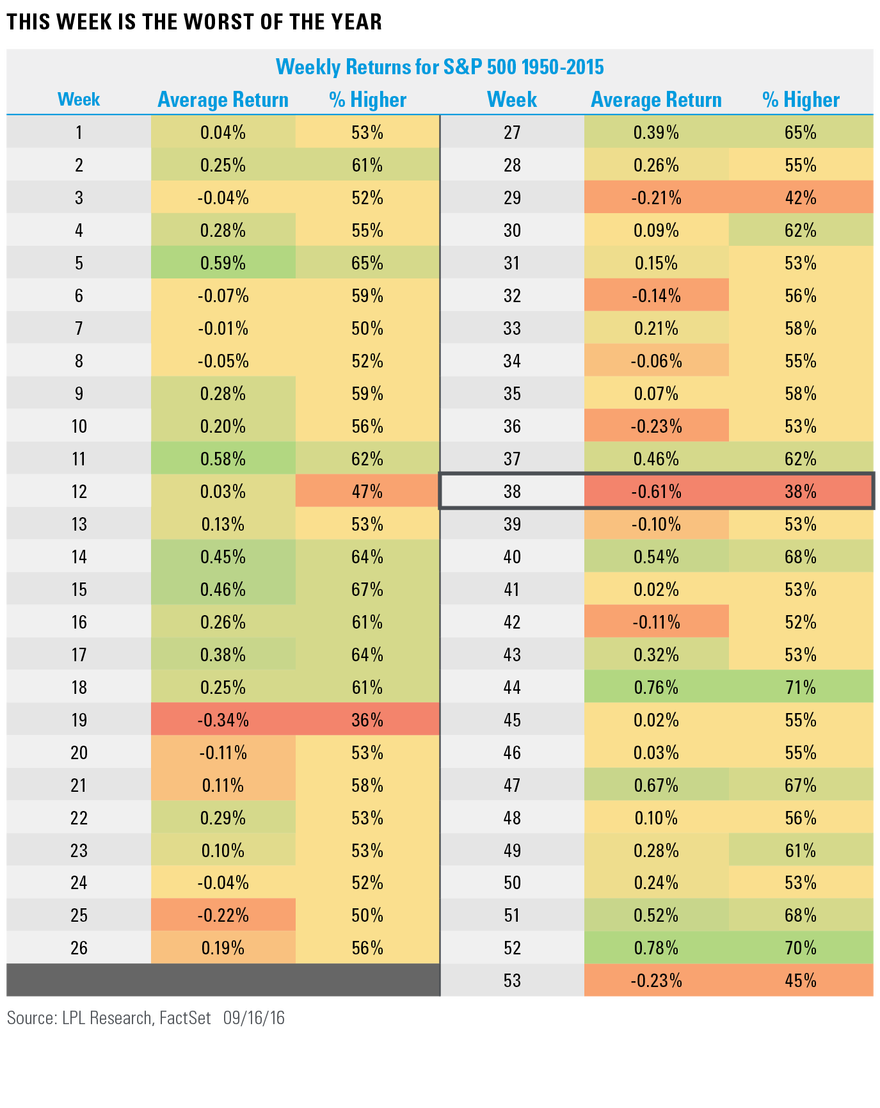
As we noted last week, the first half of September is historically strong for equities, while the real weakness tends to hit in the second half of the month. With that, this week is the 38th week of the year, and going back to 1950, no week sports a worse average return for the S&P 500, at -0.61% on average. Looking at recent action, this week has dropped for five straight years and during seven of the past eight years—with six of those seven weekly drops coming in at more than 1%.
Additionally, last week was September option expiration (which takes place on the third Friday of each month) and the week after this event tends to be very weak as well. Going back to 1990, the week following September option expiration (this week) has been higher only 4 times during the past 26 years, which is only 15.4% of the time; the week after option expiration in March and June are the next worse, with gains 26.9% of the time.
The next five weeks represent one of the weakest periods for equities based on seasonality. Should this weakness occur, we would not view this as a reason to panic; instead, we would likely consider buying the dip, as we are looking for equities to end the year near current levels with mid-single-digit S&P 500 returns for 2016, as stated in our Midyear Outlook 2016 publication.*
IMPORTANT DISCLOSURES
*As noted in our Midyear Outlook 2016 publication, we believe the conditions are in place for a solid earnings rebound during the second half of 2016, due to the easing drags from the U.S. dollar and oil, coupled with minimal wage pressures. A slight increase in price-to-earnings ratios (PE) above 16.6 is possible as market participants gain greater clarity on the U.S. election and the U.K.’s relationship with Europe, and begin to price in earnings growth in 2017. Following several quarters of earnings declines, a turnaround in growth should support our forecast for mid-single-digit gains for stocks in 2016.
Past performance is no guarantee of future results. All indexes are unmanaged and cannot be invested into directly.
The opinions voiced in this material are for general information only and are not intended to provide or be construed as providing specific investment advice or recommendations for any individual security.
The economic forecasts set forth in the presentation may not develop as predicted.
Investing in stock includes numerous specific risks including: the fluctuation of dividend, loss of principal and potential illiquidity of the investment in a falling market.
The S&P 500 Index is a capitalization-weighted index of 500 stocks designed to measure performance of the broad domestic economy through changes in the aggregate market value of 500 stocks representing all major industries.
This research material has been prepared by LPL Financial LLC.
To the extent you are receiving investment advice from a separately registered independent investment advisor, please note that LPL Financial LLC is not an affiliate of and makes no representation with respect to such entity.
Not FDIC/NCUA Insured | Not Bank/Credit Union Guaranteed | May Lose Value | Not Guaranteed by any Government Agency | Not a Bank/Credit Union Deposit
Securities and Advisory services offered through LPL Financial LLC, a Registered Investment Advisor Member FINRA/SIPC
Tracking # 1-536637 (Exp. 09/17)
Copyright © LPL Research


