by Jennifer Thomson, Gavekal Capital
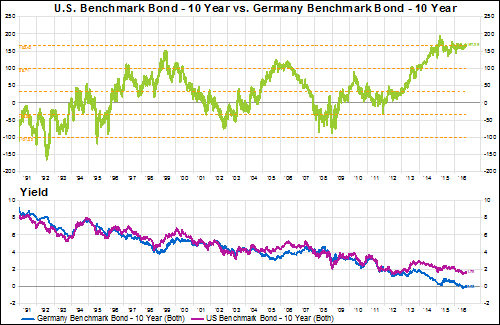
Yesterday, when it seemed everyone was getting a bit overexcited about the severity of recent market weakness, we took a look at some of our internal indicators and found that just two sectors have reached technically oversold levels (details here). Today, the topic du jour seems to be the impending rise in U.S. rates and the bursting of the multi-decade bond bubble. Before we get too worked up over the chances for an aggressive sell-off in government bonds, let’s consider the following chart. In the top pane, we have the spread between U.S. and German 10-year bond yields (green line). The orange dotted lines represent the 25-year average (about 30 bps) and the first and second standard deviations from that average. In the bottom portion of the chart, the pink line is the U.S. 10-year yield (currently 1.70%) and the blue line is the German bund (at 0.03%).

Excepting the years following the fall of the Berlin wall, U.S. rates have been higher than their German counterpart in nearly every non-recessionary/ financial crisis year. In addition, the spread has been at a quarter-century, two standard deviation high for almost two years now (since October 2014). At other extremes– highs in 1999 and 2005/6 and lows in 2002 and 2008/9– the spread has reverted back towards the average much more quickly.
Based on this relationship over the last 25 years, we might expect the spread to narrow from current levels. In order for that to occur, there must be some combination of a fall in the U.S. 10-year yield and/or a rise in the German 10-year yield. Given the ECB’s current quantitative easing efforts (and its reliance on German debt, in particular), the probability of a rise in German yields would seem unlikely at best. Which means that the normalization of this relationship is dependent on a further decline in the U.S. yield. No imminent signs of a bursting bond bubble here, folks.
Copyright © Gavekal Capital


