by LPL Research
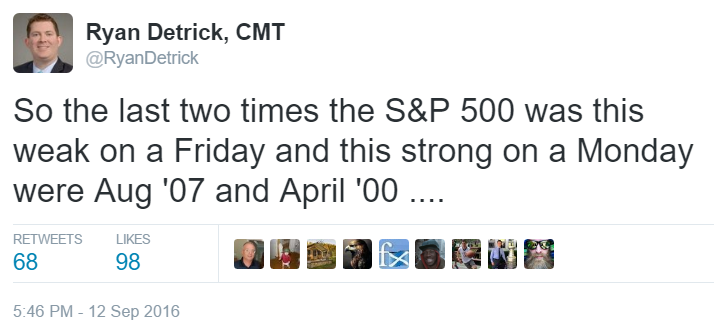
After going 43 days without a 1% move (up or down) for the S&P 500, volatility has come back with a big 2.4% drop on Friday and a nice 1.5% bounce back up on Monday. In fact, as we noted on Twitter yesterday, the last two times something like that happened were right ahead of the past two market crashes.
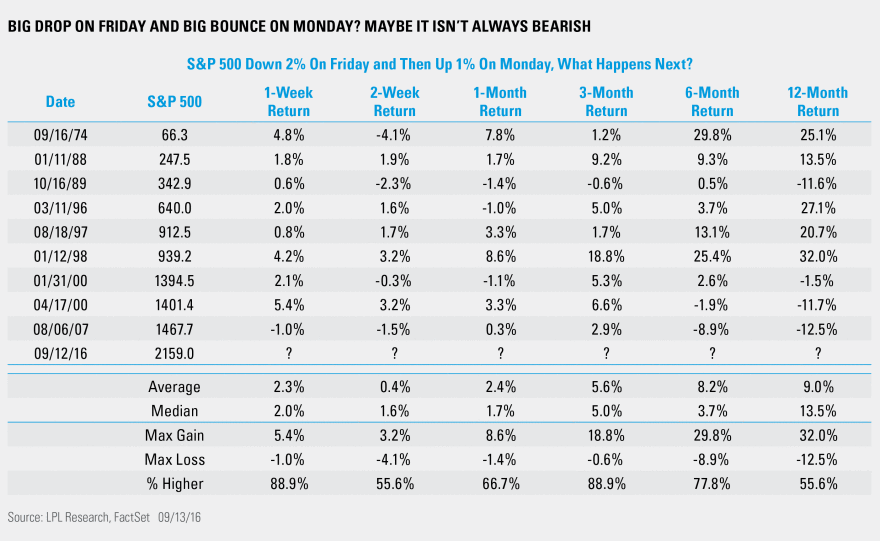
So, is this weakness on Friday and strength on Monday giving us a subtle clue of equity weakness to follow? Well, going back to 1928 there have been 35 times the S&P 500 dropped 2% on a Friday and bounced back at least 1% the following Monday. The majority of those instances took place during the 1930s (like most volatility records), but looking at the nine times it has happened since 1950 shows there is actually future strength, on average. Higher 2.3% a week later, on average, and higher eight out of nine times is rather impressive. Going out three and six months also shows potential strength.
Sure, the past two times this happened led to eventual bear markets, but digging a little deeper shows this isn’t the warning sign it might have seemed to be. Taking this one step further, let’s look at all the times on any day the S&P 500 dropped 2%, then followed it up with a 1% gain (so not just Friday/Monday combinations)—that has happened 91 previous times since 1950. Near-term returns look about average, but going out a full year, the average return jumps to +14.5% and is higher 78% of the time, again showing this event isn’t what we’d classify as bearish.
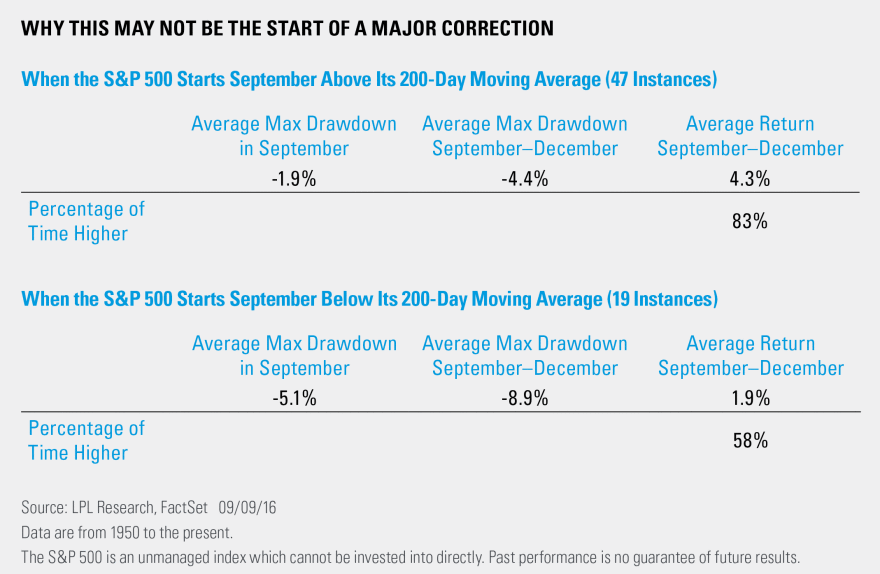
After an hour of trading today, the S&P 500 is already down another percent. Could this recent volatility and weakness be the start to a major bear market, or is it a more normal correction during this seasonally weak time frame? To answer this, we’d like to reiterate a study we shared in this week’s Weekly Market Commentary. As you can see below, since 1950, when the S&P 500 starts the usually weak month of September in an uptrend and above its 200-day moving average (like 2016 did), the odds of a major correction are rather slim.
Look at it this way—the 19 times September started beneath its 200-day moving average, six of those years saw a pullback of at least 10% before the end of the year (with 2008’s 41.3% drop leading the way). Now compare that with the 47 times the S&P 500 started September above its 200-day moving average (again, like 2016 did). Only three times did it correct as much as 10% before the end of the year, with one of those being a 32% correction during 1987 (1978 and 2000 were the others). All of this suggests that some usual September/October weakness and volatility is normal and to be expected. The good news is, the likelihood that it leads to a substantial pullback is rather slim.
IMPORTANT DISCLOSURES
Past performance is no guarantee of future results. All indexes are unmanaged and cannot be invested into directly.
The opinions voiced in this material are for general information only and are not intended to provide or be construed as providing specific investment advice or recommendations for any individual security.
The economic forecasts set forth in the presentation may not develop as predicted.
Investing in stock includes numerous specific risks including: the fluctuation of dividend, loss of principal and potential illiquidity of the investment in a falling market.
The S&P 500 Index is a capitalization-weighted index of 500 stocks designed to measure performance of the broad domestic economy through changes in the aggregate market value of 500 stocks representing all major industries.
This research material has been prepared by LPL Financial LLC.
To the extent you are receiving investment advice from a separately registered independent investment advisor, please note that LPL Financial LLC is not an affiliate of and makes no representation with respect to such entity.
Not FDIC/NCUA Insured | Not Bank/Credit Union Guaranteed | May Lose Value | Not Guaranteed by any Government Agency | Not a Bank/Credit Union Deposit
Securities and Advisory services offered through LPL Financial LLC, a Registered Investment Advisor Member FINRA/SIPC
Tracking #1-535069 (Exp. 09/17)
Copyright © LPL Research


