by Eric Norland, Executive Director and Senior Economist, CME, via S&P Dow Jones Indices
Equity markets are notoriously volatile, at least when compared to fixed income. Dividend payments, by contrast, while not fixed like many bond coupons, offer market participants a much less volatile and more fixed income-like risk and return profile. For the 25 years from 1990 to 2015, the annual variation in S&P 500® dividend points has been 7.65%, compared to 17.4% for the S&P 500® itself. Similarly, since the inauguration of the S&P 500® Dividend future, the realized volatility of the December 2020 contract has been 6.5%, annualized, compared to 15.8% for the E-Mini S&P 500® Index future.
Dividends and GDP Correlation
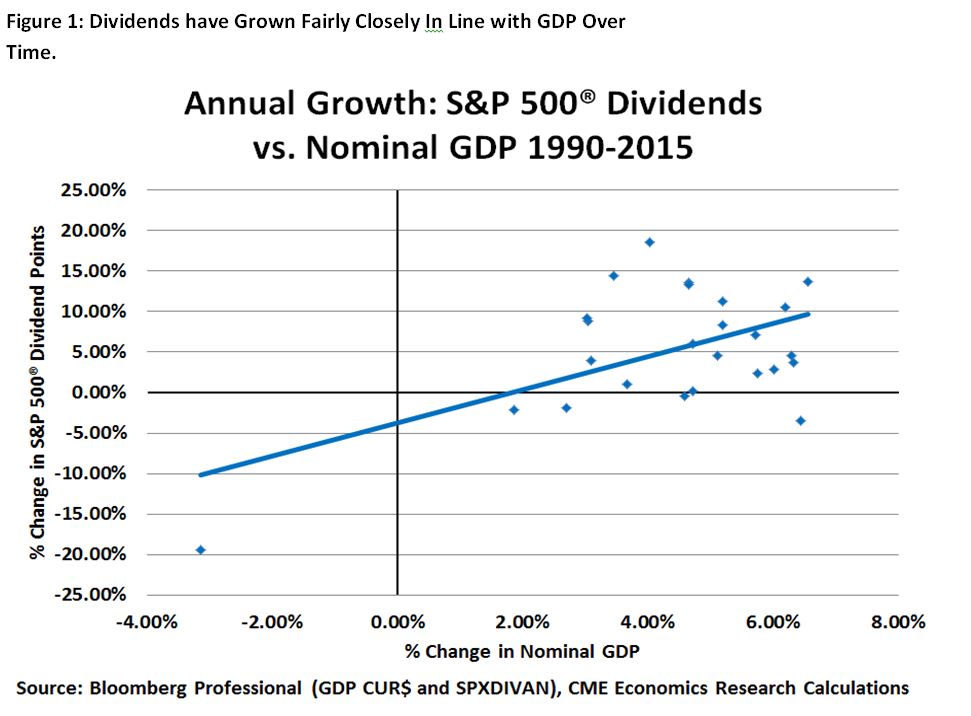
Although payout ratios and corporate earnings as a percentage of GDP change over time, S&P 500® dividend payments have correlated with changes in nominal GDP at around 50% since 1990 (Figure 1). This contrasts sharply with the S&P 500® itself, whose correlation with annual changes in GDP is only 0.1% over the same period. This is largely because equities anticipate future changes in GDP whereas dividends are more apt to reflect present conditions.

Bottom Line
- The main drivers of dividends are corporate profit growth and payout ratios.
- Corporate profits vary as a percentage of GDP, and payout ratios can be influenced by the economic cycle and tax policy.
- While corporate earnings are challenged by the low inflation and sluggish global growth environment, which may lead to more stock price volatility, dividends are far less volatile than equity indices, displaying slightly less than half of the annualized variation.
All examples in this report are hypothetical interpretations of situations and are used for explanation purposes only. The views in this report reflect solely those of the author and not necessarily those of CME Group or its affiliated institutions. This report and the information herein should not be considered investment advice or the results of actual market experience.
S&P Dow Jones Indices is an independent third party provider of investable indices. We do not sponsor, endorse, sell or promote any investment fund or other vehicle that is offered by third parties. The views and opinions of any third party contributor are his/her own and may not necessarily represent the views or opinions of S&P Dow Jones Indices or any of its affiliates.
Copyright © S&P Dow Jones Indices


