by Don Vialoux, Timingthemarket.ca
Economic News This Week
Weekly Initial Jobless Claims to be reported at 8:30 AM EDT on Thursday are expected to increase to 263,000 from 259,000 last week.
August Retail Sales to be released at 8:30 AM EDT on Thursday are expected to slip 0.1% versus no change in July. Excluding auto sales, August Retail Sales are expected to increase 0.3% versus a decline of -/3% in July.
August Producer Prices to be released at 8:30 AM EDT on Thursday are expected to increase 0.1% versus a decline of 0.4% in July. Excluding food and energy, August Producer Prices are expected to increase 0.1% versus a decline of 0.3% in July.
September Philly Fed Index to be released at 8:30 AM EDT on Thursday is expected to be unchanged versus +2.0 in August.
August Industrial Production to be released at 9:15 AM EDT on Thursday is expected to decline 0.3% versus a gain of 0.7% in July. August Capacity Utilization is expected to slip to 75.7% from 75.7% in July.
July Business Inventories to be released at 10:00 AM EDT on Thursday are expected to increase 0.1% versus a gain of 0.2% in June.
August Consumer Prices to be released at 8:30 AM EDT on Friday is expected to increase 0.1% versus no change in July. Excluding food and energy, August Consumer Prices are expected to increase 0.2% versus a gain of 0.1% in July.
September Michigan Sentiment Index to be released at 10:00 AM EDT on Friday is expected to improve to 91.5 from 89.8.
Earnings Reports This Week
Quiet week! Oracle is expected to report on Thursday.
The Bottom Line
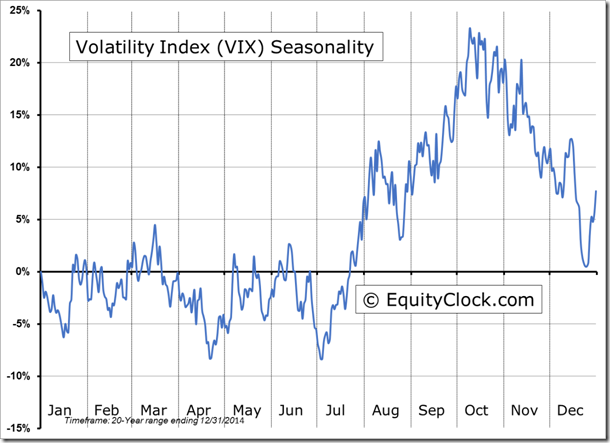
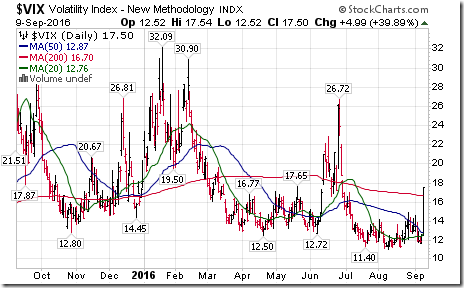
The spike in volatility on Friday is start of the usual mid-September to mid-October “season of fear”. Technical, seasonal and fundamental factors point to an extension of an intermediate correction by equity markets. Traders and seasonal investors should respond accordingly.
Observations
A normally minor comment by a Federal Reserve official early on Friday triggered an avalanche of selling in both the equity and the Treasuries market. Federal Reserve’s Bank of Boston representative Eric Rosengren noted that a “Reasonable case can be made for tightening interest rates to avoid overheating the economy”. Previously, Rosengren’s comments had been “dovish” implying the retention of the Fed Fund rate at 0.50%. Traders used his comments as an excuse to sell Treasuries at a critical time when yields on long term bonds were testing 3 month highs. The resulting breakout in yields (breakdowns in prices) triggered selling in U.S. equities. Almost 100 S&P 500 stocks broke intermediate support levels, which, in turn triggered additional technical selling in U.S. equities. Last week only 19 S&P 500 stocks broke intermediate resistance levels while 104 stocks broke intermediate support levels (most of them on Friday). Number of S&P 500 stocks in intermediate uptrend dropped last week to 258 from 314. Number of stocks in neutral trends increased to 70 from 60. Number of stocks trading in intermediate downtrend increased to 182 from 136.
Economic news this week is expected to show a slowdown in growth in the U.S. economy (slowing retail sales, declining Philly Fed, dropping Industrial Production, falling capacity utilization, stagnant CPI and PPI).
Medium and short term technical indicators turned sharply lower on Friday. Their extension is expected early this week.
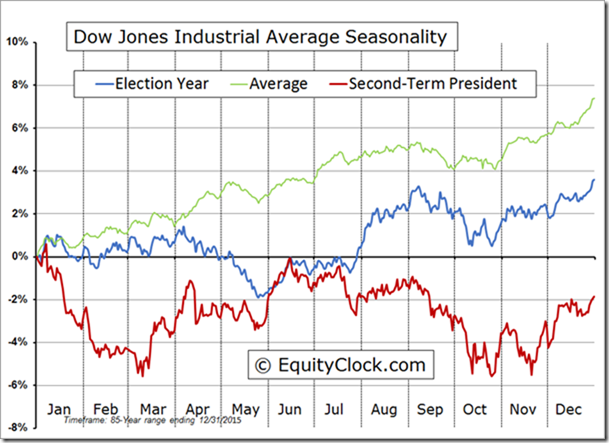
U.S. equity markets have a history of moving lower between now and a week before the Presidential election.
Earnings news is not a factor this week. Oracle is the focus. Three S&P companies are scheduled to report. Most major U.S and Canadian companies are entering into their “quiet period” prior to release of third quarter results.
Seasonal influences for a wide variety of equity markets, commodities and sectors turn negative from mid-September to mid-October. Note changes in seasonality included in our tables.
Third and fourth quarter earnings and revenue estimates for S&P 500 companies remained relatively stable last week. Consensus is calling for a year-over-year 2.0% decline in third quarter earnings and a 2.6% increase in revenues. Consensus for the fourth quarter calls for a 5.8% increase in earnings and a 5.3% gain in revenues. According to FactSet, S&P 500 earnings in 2017 will increase 13.5% on a 5.9% increase in revenues.
Equity Indices and Related ETFs
Daily Seasonal/Technical Equity Trends for September 9th 2016
Green: Increase from previous day
Red: Decrease from previous day
Calculating Technical Scores
Technical scores are calculated as follows:
Intermediate Uptrend based on at least 20 trading days: Score 2
Higher highs and higher lows
Intermediate Neutral trend: Score 0
Not up or down
Intermediate Downtrend: Score -2
Lower highs and lower lows
Outperformance relative to the S&P 500 Index: Score: 2
Neutral Performance relative to the S&P 500 Index: 0
Underperformance relative to the S&P 500 Index: Score –2
Above 20 day moving average: Score 1
At 20 day moving average: Score: 0
Below 20 day moving average: –1
Up trending momentum indicators (Daily Stochastics, RSI and MACD): 1
Mixed momentum indicators: 0
Down trending momentum indicators: –1
Technical scores range from -6 to +6. Technical buy signals based on the above guidelines start when a security advances to at least 0.0, but preferably 2.0 or higher. Technical sell/short signals start when a security descends to 0, but preferably -2.0 or lower.
Long positions require maintaining a technical score of -2.0 or higher. Conversely, a short position requires maintaining a technical score of +2.0 or lower
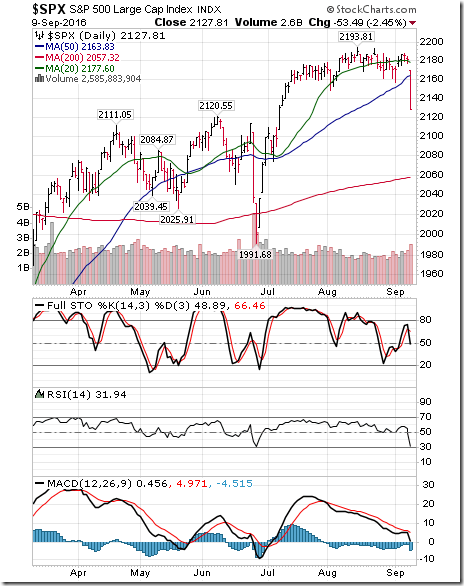
The S&P 500 Index dropped 52.17 points (2.39%) last week. Intermediate trend remains up. The Index dropped below its 20 day moving average on Friday. Short term momentum indicators turned down again on Friday. Technical score slipped last week to 0 from 2.
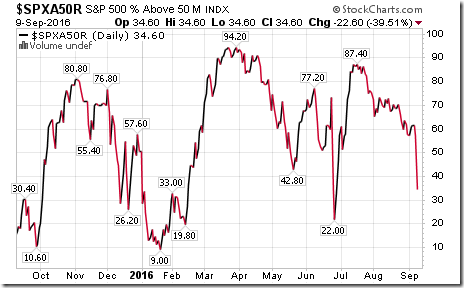
Percent of S&P 500 stocks trading above their 50 day moving average (Also known as the S&P 500 Momentum Barometer) plunged last week to 34.60% from 61.00% with most of the decline happening on Friday. Percent already has dropped to an intermediate oversold level, but continues to trend down.
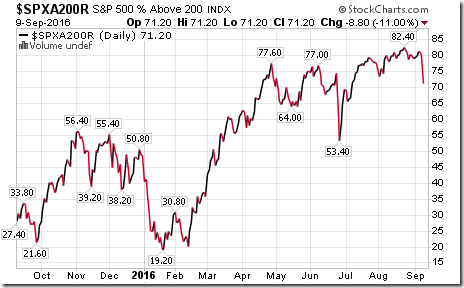
Percent of S&P 500 stocks trading above their 200 day moving average dropped last week to 71.20 from 80.20. Percent is intermediate overbought and trending down.
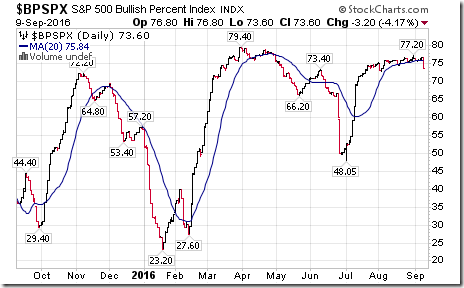
Bullish Percent Index for S&P 500 stocks dropped last week to 73.60% from 75.80% and remained below its 20 day moving average. The Index is intermediate overbought and trending down.
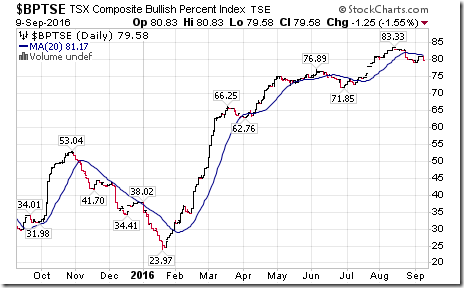
Bullish Percent Index for TSX Composite stocks was unchanged last week at 79.58% and remained below its 20 day moving average. The Index remains intermediate overbought and trending down.
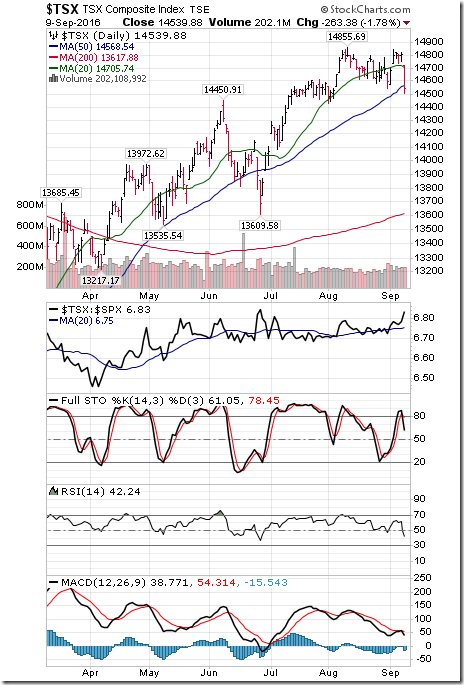
The TSX Composite Index dropped 255.82 points (1.73%) last week with the entire drop happening on Friday. Intermediate trend remains up (Score: 2). Strength relative to the S&P 500 Index improved to positive from neutral (Score: 2). The Index dropped below its 20 day moving average on Friday (Score: -1). Short term momentum indicators are trending down (Score: -1). Technical score dipped last week to 2 from 4.
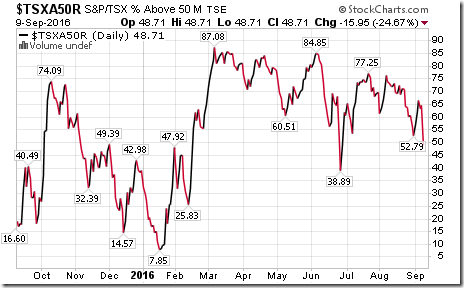
Percent of TSX stocks trading above their 50 day moving average (Also known as the TSX Momentum Barometer) plunged last week to 48.71% from 62.23%. Percent has dropped to an intermediate neutral zone on Friday, but continues to trend down.
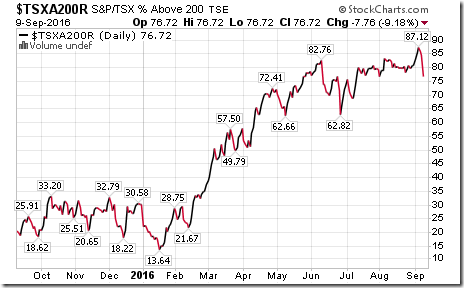
Percent of TSX stocks trading above its 200 day moving average dropped last week to 76.72% from 85.41% with most of the drop happening on Friday. Percent is intermediate overbought and trending down.
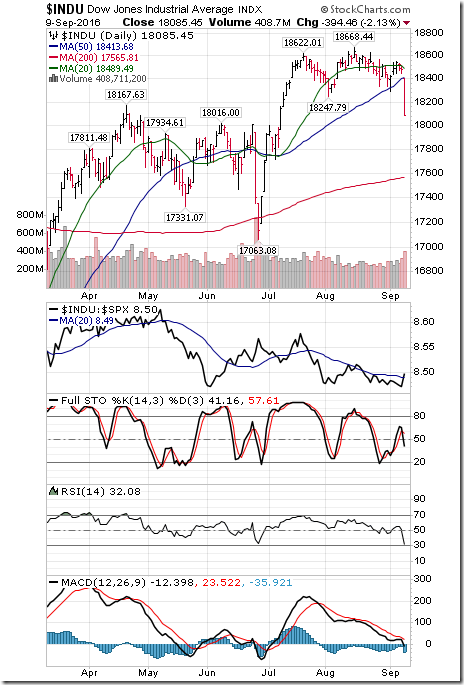
Dow Jones Industrial Average dropped 406.51 points (2.20%) last week. Intermediate trend changed on Friday to neutral from up on a move below 18,247.79. Strength relative to the S&P 500 Index remained neutral. The Average remained below its 20 day moving average. Short term momentum indicators turned down on Friday. Technical score dipped last week to -2 from 0.
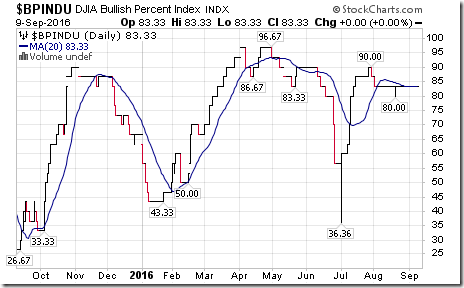
Bullish Percent Index for Dow Jones Industrial Average stocks was unchanged last week at 83.33% and continued to match its 20 day moving average. The Index remains intermediate overbought.
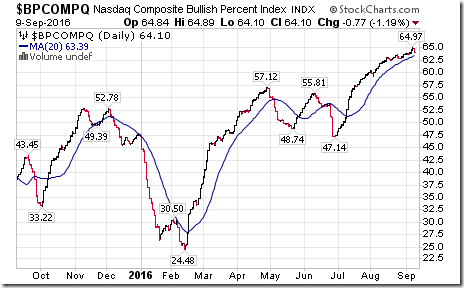
Bullish Percent Index for NASDAQ Composite stocks increased last week to 64.10% from 63.70% and remained above its 20 day moving average. The Index remains intermediate overbought.
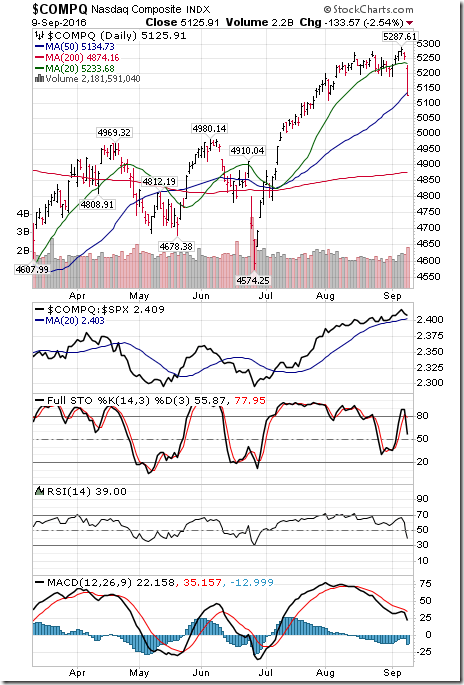
The NASDAQ Composite Index dropped 123.99 points (2.36%) last week. Intermediate trend remains up. Strength relative to the S&P 500 Index remains positive. The Index dropped below its 20 day moving average on Friday. Short term momentum indicators turned lower on Friday. Technical score slipped last week to 2 from 4.
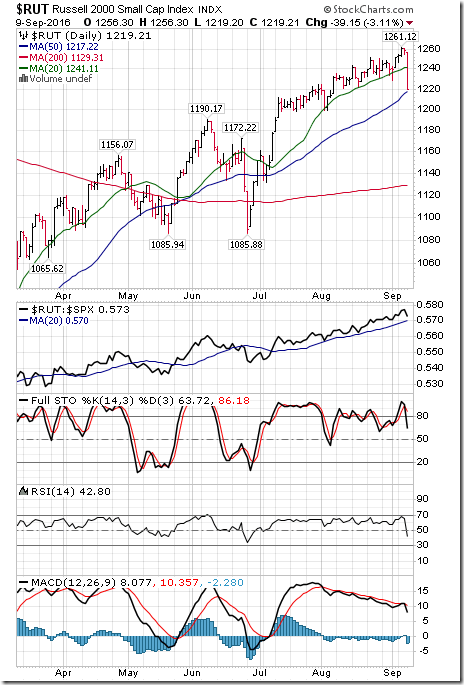
Russell 2000 Index dropped 32.62 points (2.61%) last week. Intermediate trend remains up. Strength relative to the S&P 500 Index remains positive. The Index dropped below its 20 day moving average on Friday. Short term momentum indicators turned down on Friday. Technical score slipped last week to 2 from 4.
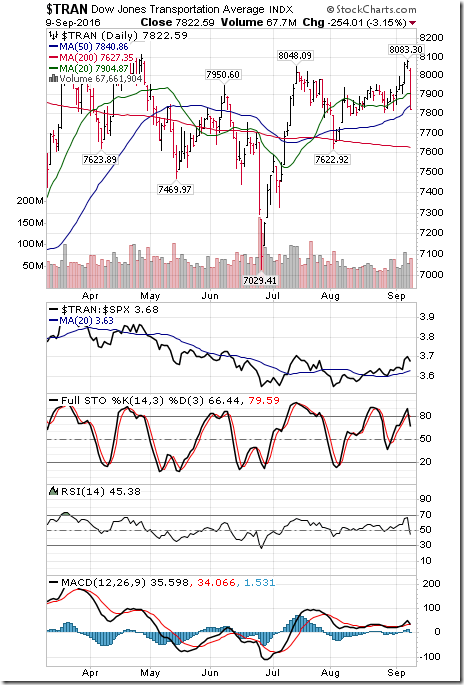
Dow Jones Transportation Average dropped 124.20 points (1.56%) last week. Intermediate trend changed to up from neutral on a move above 8,048.09. Strength relative to the S&P 500 Index remained positive. The Average dropped below its 20 day moving average on Friday. Short term momentum indicators turned down on Friday. Technical score slipped last week to 2 from 4.
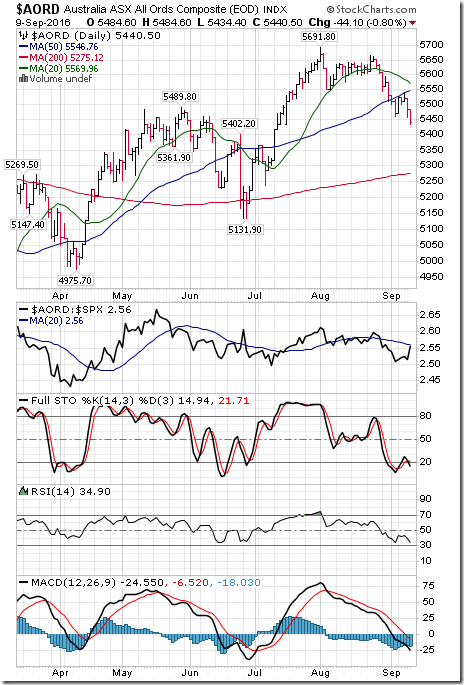
The Australia All Ordinaries Composite Index slipped 30.10 points (0.55%) last week. Intermediate trend remains down. Strength relative to the S&P 500 Index remains negative. The Index remained below its 20 day moving average. Short term momentum turned down on Friday. Technical score remained last week at -6.
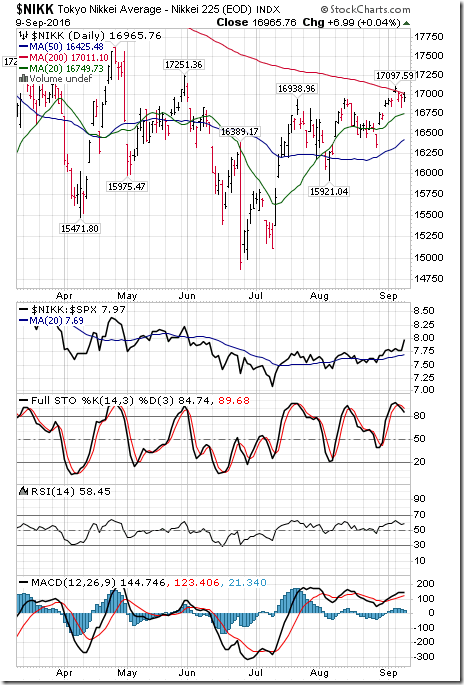
The Nikkei Average added 40.08 points (0.24%) last week. Intermediate trend changed last week to up from down on a move above 16,938.96. Strength relative to the S&P 500 Index remained positive. The Average remains above its 20 day moving average. Short term momentum indicators are trending up. Technical score improved last week to 6 from 2.
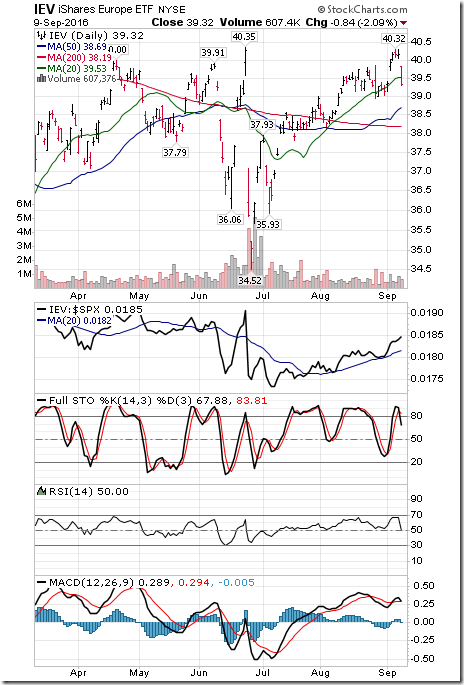
Europe iShares dropped $0.63 (1.58%) last week. Intermediate trend remains down. Strength relative to the S&P 500 Index remains positive. Units dropped below their 20 day moving average on Friday. Short term momentum indicators turned down on Friday. Technical score dropped last week to -2 from 2.
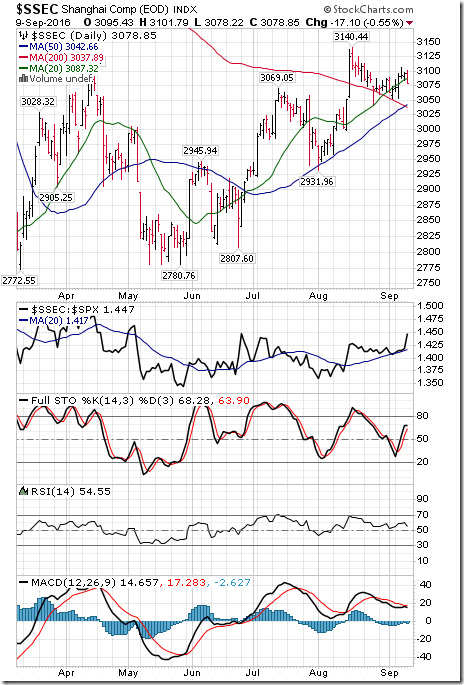
The Shanghai Composite Index added 11.50 points (0.37%) last week. Intermediate trend remains up. Strength relative to the S&P 500 Index remains positive. Units dropped below their 20 day moving average on Friday. Short term momentum indicators are trending up. Technical score improved last week to 6 from 4.
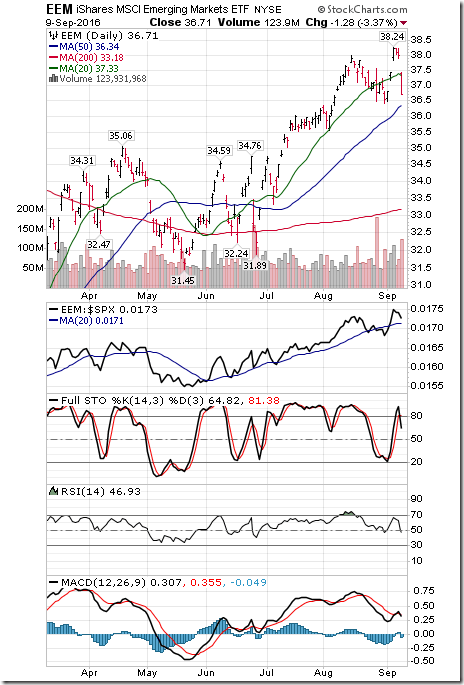
Emerging Markets iShares dropped $0.70 (1.87%) last week. Intermediate uptrend was confirmed on a move above $37.98. Strength relative to the S&P 500 Index changed to positive from neutral. Units fell below their 20 day moving average on Friday. Short term momentum indicators turned down on Friday. Technical score slipped last week to 2 from 4.
Currencies
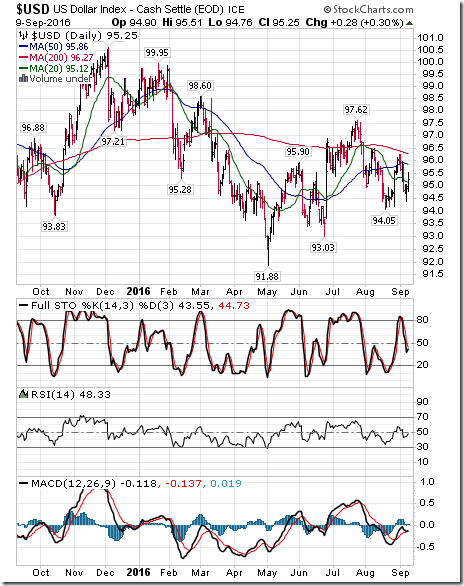
The U.S. Dollar Index slipped 0.59 (0.62%) last week despite gains recorded on Friday. The Index recovered to above its 20 day moving average on Friday. Short term momentum indicators are mixed.
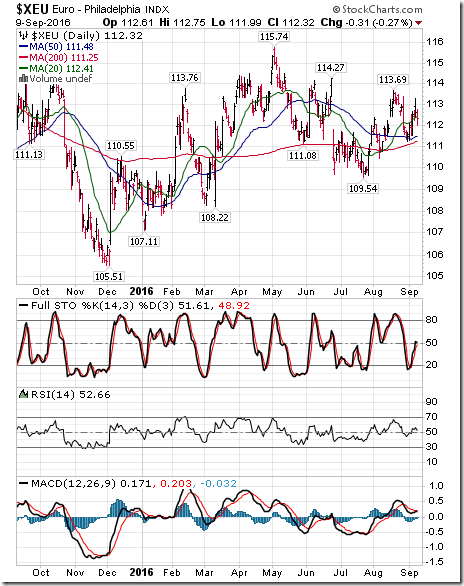
The Euro added 0.43 (0.38%) last week. Intermediate trend remained neutral. The Euro slipped back again below its 20 day moving average on Friday. Short term momentum indicators are mixed.
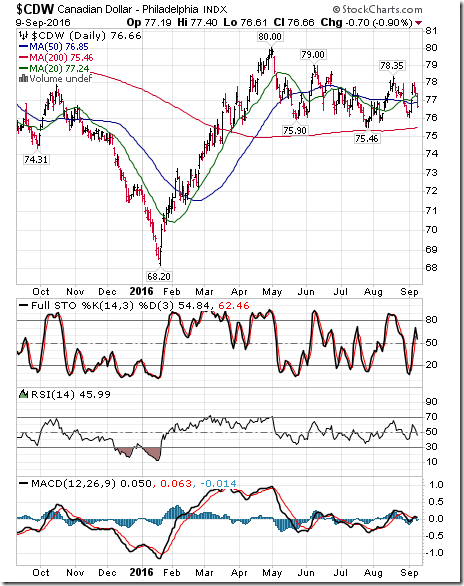
The Canadian Dollar dropped U.S. 0.32 cents (0.42%) last week. Intermediate trend remains down. The Canuck Buck dropped below its 20 day moving average on Friday. Short term momentum indicators are mixed
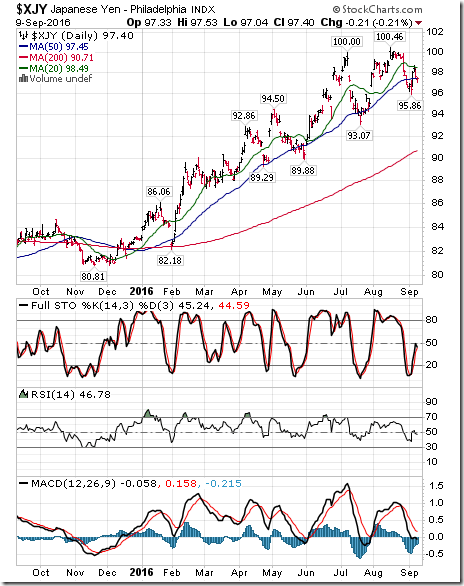
The Japanese Yen gained 1.03 91.07%) last week. Intermediate trend remains up. The Yen remained below its 20 day moving average. Short term momentum indicators are mixed.
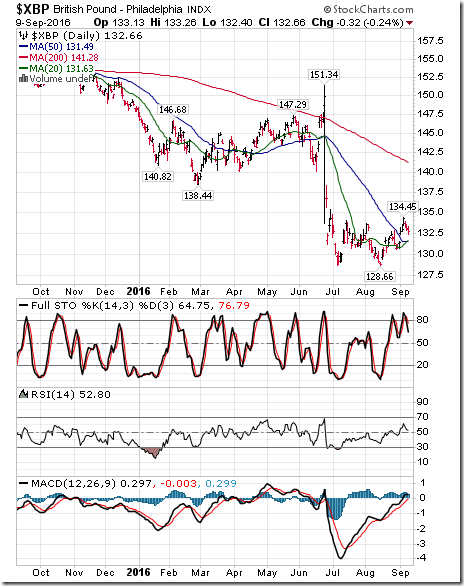
The British Pound slipped 0.27 (0.20%) last week. Intermediate trend changed to neutral from down on a move above 133.01. The Pound remained above its 20 day moving average. Short term momentum indicators are mixed
Commodities
Daily Seasonal/Technical Commodities Trends for September 9th 2016
Green: Increase from previous day
Red: Decrease from previous day
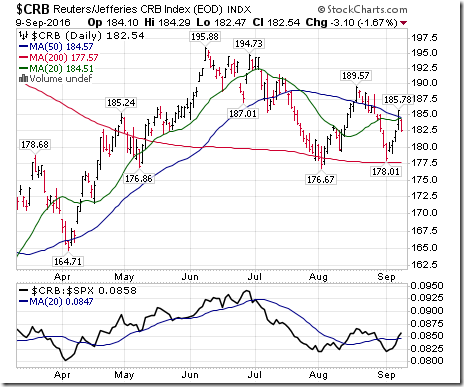
The CRB Index gained 2.55 points (1.42%) last week. Intermediate trend remains down. Strength relative to the S&P 500 Index changed to neutral from negative. The Index moved back below its 20 day moving average on Friday. Short term momentum indicators are trending up. Technical score improved last week to -2 from -6
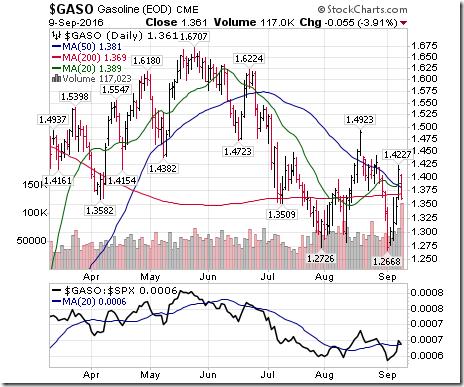
Gasoline added 5.9 cent per gallon (4.53%) last week. Intermediate trend remains down. Strength relative to the S&P 500 Index improved to neutral from negative. Gas dropped back below its 20 day moving average on Friday. Short term momentum indicators are trending up. Technical score improved last week to -2 from -6
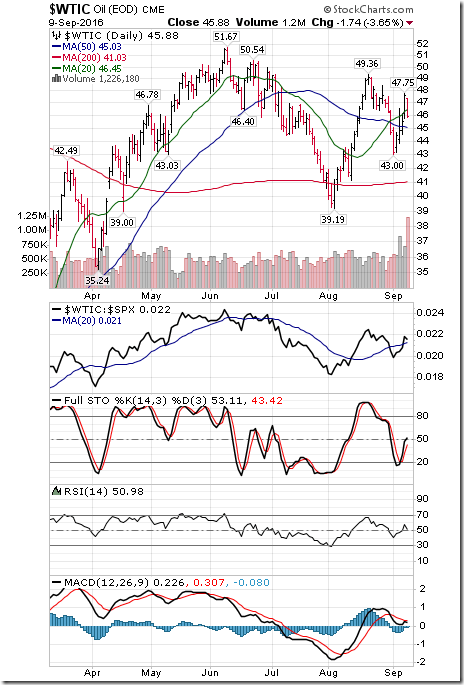
Crude oil added $0.44 per barrel (0.99%) last week. Intermediate trend remains up. Strength relative to the S&P 500 Index changed to neutral from negative. Crude moved above its 20 day moving average. Short term momentum indicators are trending up. Technical score improved last week to 4 from -2.
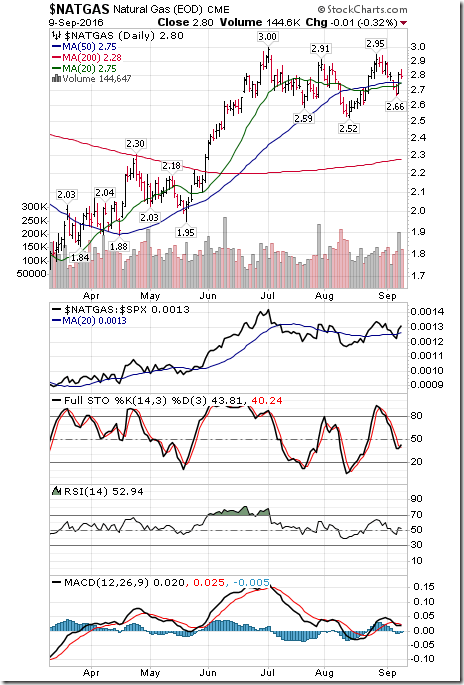
Natural Gas added $0.01 per MBtu (0.36%) last week. Intermediate trend remains neutral. Strength relative to the S&P 500 Index remained neutral. “Natty” remained above its 20 day moving average. Short term momentum indicators are trending down. Technical score slipped last week to 0 from 2.
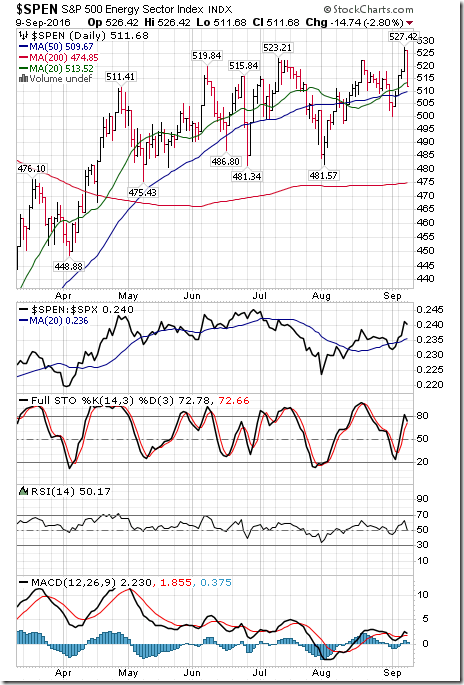
The S&P Energy Index added 3.33 points (0.66%) last week. Intermediate trend changed to up from neutral on a move above 523.21. Strength relative to the S&P 500 Index changed to positive from neutral. The Index dropped below its 20 day moving average on Friday. Short term momentum indicators have turned down. Technical score improved last week to 2 from -2.
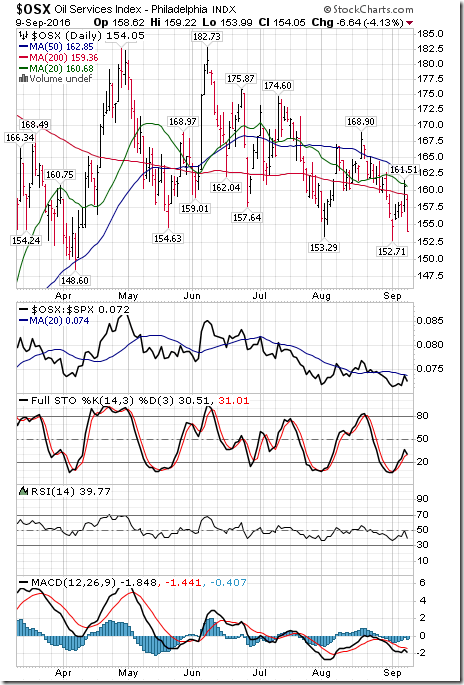
The Philadelphia Oil Services Index dropped 1.89 points (1.21%) last week. Intermediate trend remains down. Strength relative to the S&P 500 Index improved to neutral from negative. The Index remains below its 20 day moving average. Short term momentum indicators are trending up. Technical score improved last week to -2 from -6.
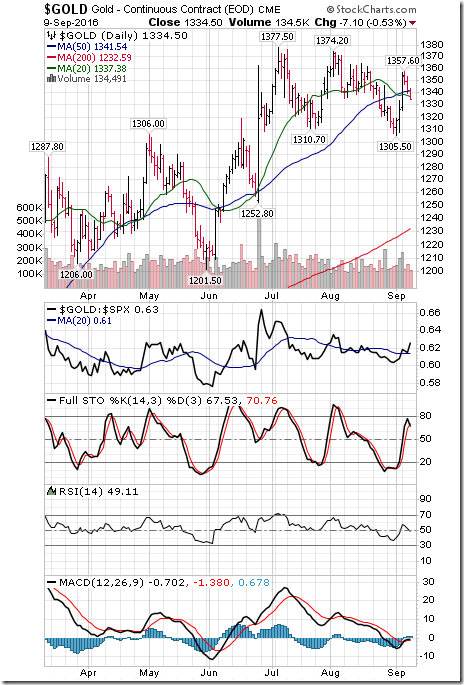
Gold gained $7.80 per ounce (0.59%) last week. Intermediate trend remains up. Strength relative to the S&P 500 Index changed to positive from neutral on Friday. Gold dropped below its 20 day moving average on Friday. Short term momentum indicators are trending up. Technical score improved last week to 4 from 2.
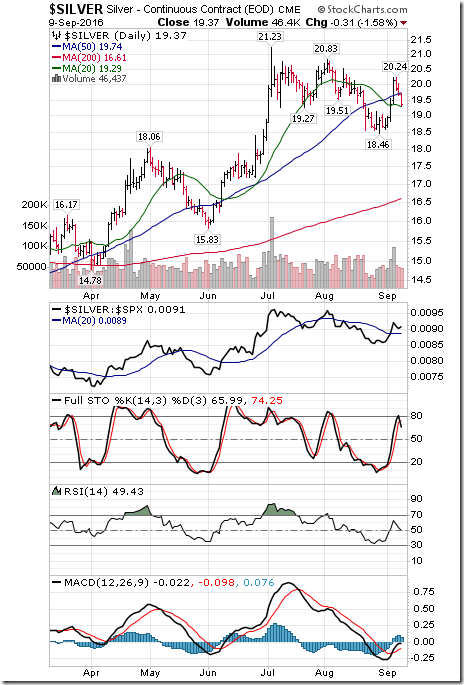
Silver was unchanged last week. Intermediate trend remained down. Strength relative to the S&P 500 Index changed to positive from neutral. Silver remained above its 20 day moving average. Short term momentum indicators are trending up. Technical score improved last week to 2 from 0. Strength relative to Gold is slightly positive.
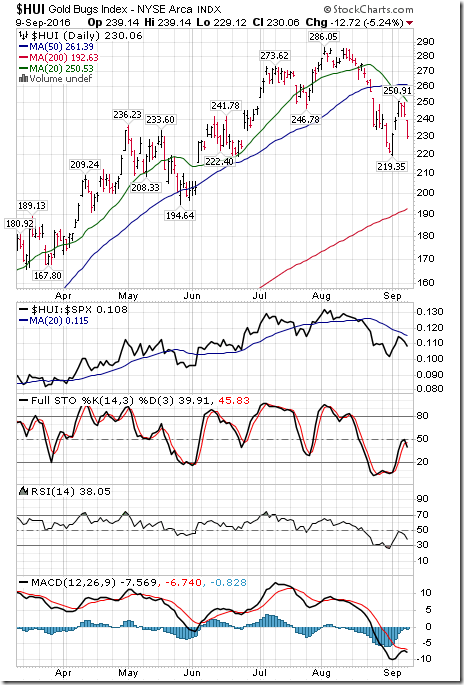
The AMEX Gold Bug Index dropped 9.36 points (3.93%) last week. Intermediate trend remains neutral. Strength relative to the S&P 500 Index remained negative. The Index remained below its 20 day moving average. Short term momentum indicators are trending up. Technical score remained last week at -2.
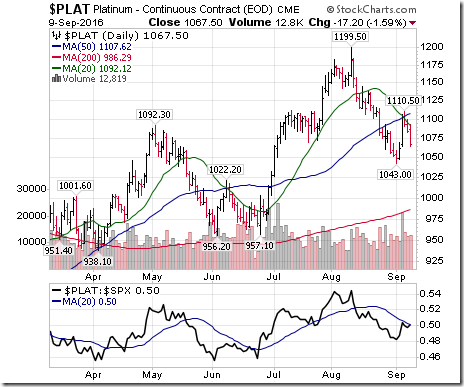
Platinum added $5.30 (0.50%) last week. Intermediate trend remains up. Relative strength remains negative. PLAT remains below its 20 day MA. Momentum is trending up.
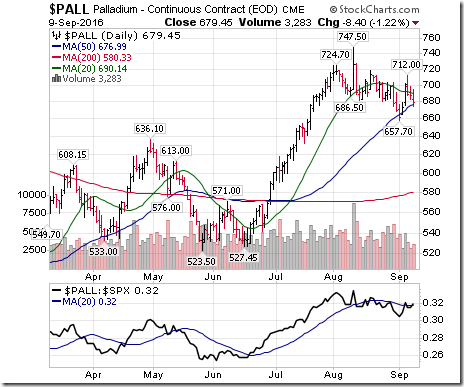
Palladium gained $5.90 per ounce (0.88%) last week. Intermediate trend remains down. Relative strength improved to neutral from negative. PALL remained below its 20 day moving average. Short term momentum indicators are trending up. Score improved to -2
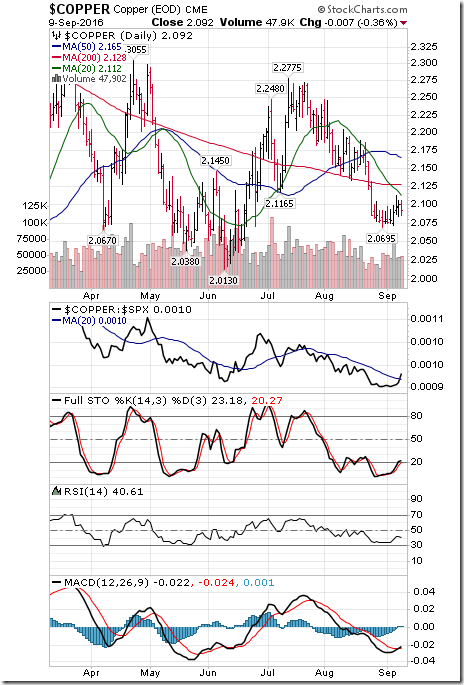
Copper added 0.014 cents (0.67%) last week. Intermediate trend remains neutral. Strength relative to the S&P 500 Index improved to neutral from negative. Copper remains below its 20 day moving average. Short term momentum indicators are trending up. Technical score improved last week to 0 from -4.
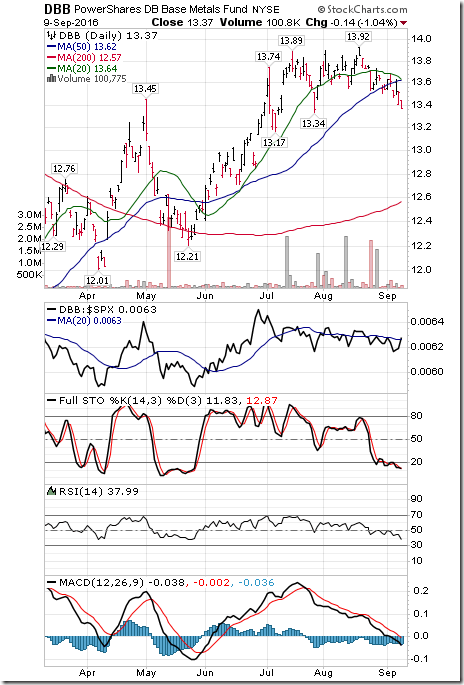
Editor’s Note: Data on the S&P Metals and Mineral Index no longer is provide to StockCharts.com. Accordingly, Tech Talk has switched to DBB, an ETN tracking a 1/3 weight equally in copper, aluminum and zinc.
DBB dropped 0.24 (1.77%) last week. Intermediate trend is up. Strength relative to the S&P 500 Index is neutral. Units trade below their 20 day moving average. Short term momentum indicators are trending down. Technical score is 0.
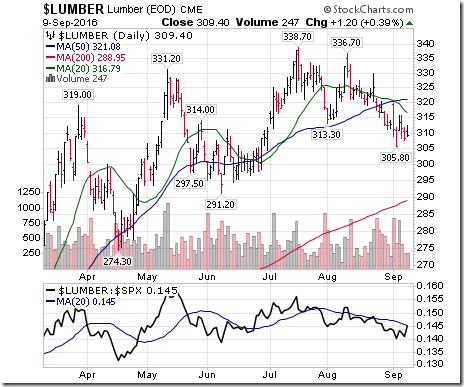
Lumber added $3.60 (1.18%) last week. Trend remains down. Relative strength remains negative. Lumber remains below its 20 day MA. Momentum: Up. Score improved to 0.
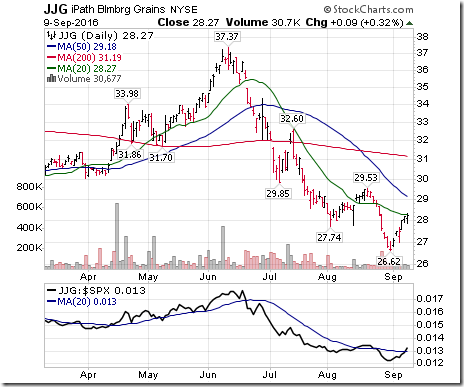
The Grain ETN added $0.78 (2.84%) last week. Intermediate trend remains up. Strength relative to the S&P 500 Index changed to neutral from negative. Units closed at their 20 day moving average on Friday. Short term momentum indicators are trending up. Score up to 1
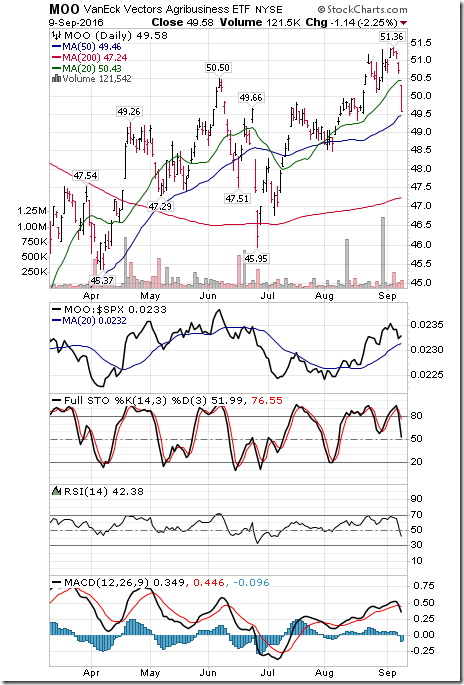
Agriculture ETF dropped $1.74 (3.39%) last week. Intermediate trend remains up. Strength relative to the S&P 500 Index remains positive. Units fell below their 20 day moving average on Friday. Short term momentum indicators are trending down. Technical score dropped last week to 2 from 6.
Interest Rates
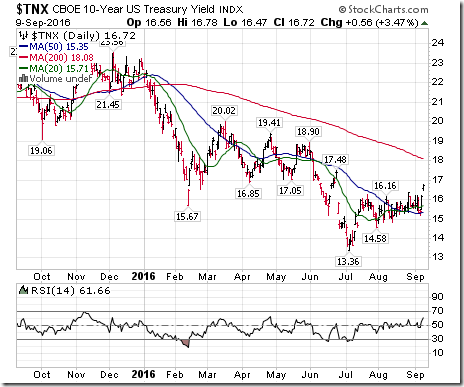
The yield on 10 year Treasuries increased 7.6 basis points (4.76%) last week. Intermediate trend changed last week to up from down on a move above 1.616%. Yield remained above its 20 day moving average. Short term momentum indicators are trending up.
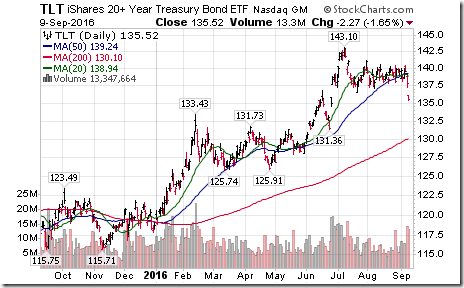
Conversely, price of the long term Treasury ETF lost $3.11 (2.24%) last week. Intermediate trend changed to down from up on a move below 136.49. Units dropped below their 20 day moving average on Friday
Volatility
The VIX Index spiked 5.52 (46.08%) last week with most of the gain recorded on Friday. The Index also moved above its 20,50 and 200 day moving average on Friday.
Sectors
Daily Seasonal/Technical Sector Trends for September 9th 2016
Green: Increase from previous day
Red: Decrease from previous day
Special Free Services available through www.equityclock.com
Equityclock.com is offering free access to a data base showing seasonal studies on individual stocks and sectors. The data base holds seasonality studies on over 1000 big and moderate cap securities and indices. To login, simply go to http://www.equityclock.com/charts/ Following are examples:
StockTwits Released on Friday
Technical action by S&P 500 stocks to 3:15 PM: Bearish. 72 stocks broke support and 1 broke resistance ($MON).
Editor’s Note: After 3:15 PM EDT, another 15 S&P 500 stocks broke intermediate support levels.
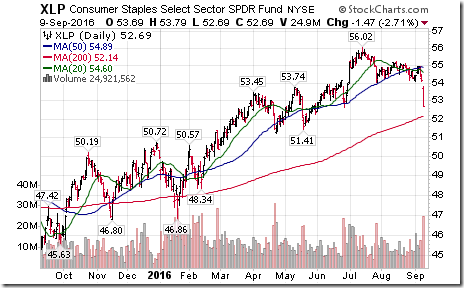
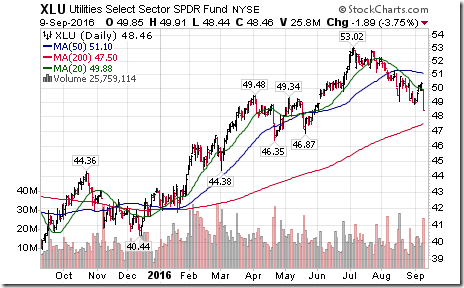
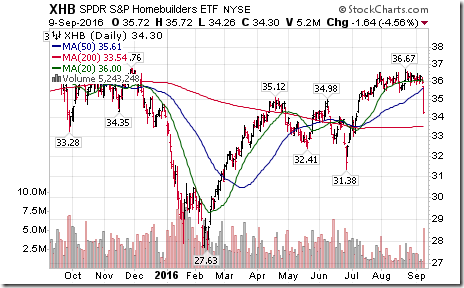
Equity weakness related to a breakdown by long Treasury prices $TLT establishing an intermediate downtrend.
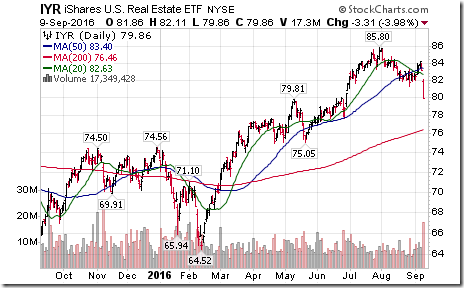
Interest sensitive sectors are the weakest: $XLP, $XLU, $XHB, $IYR
= = = = = = = = = =
Mr. Vialoux presenting at the Toronto MoneyShow
Presentation is held from 2:45 to 3:30 PM EDT
on Saturday, September 17th .
Topic is “Sell in May and Go Away???”
On the surface, headline for the presentation sounds like a recommendation to sell equities. On the contrary, the presentation will explain why “Sell in May and Go Away” no longer is accurate and, indeed, provides a watchful buying opportunity during the historically volatile mid-June to mid-October period.
Attendance at the show is free.
See you at the show!
= = = = = = = = = =
WALL STREET RAW RADIO – SEPTEMBER 10, 2016 – WITH MARK LEIBOVIT
WITH GUESTS SINCLAIR NOE, HENRY WEINGARTEN AND STEFANIE KAMMERMAN"
Disclaimer: Seasonality and technical ratings offered in this report by www.timingthemarket.ca and www.equityclock.com are for information only. They should not be considered as advice to purchase or to sell mentioned securities. Data offered in this report is believed to be accurate, but is not guaranteed
Copyright © DV Tech Talk, Timingthemarket.ca


![clip_image002[5] clip_image002[5]](https://advisoranalyst.com/wp-content/uploads/HLIC/798e1a17e299ed0cbca40338738ceaee.png)
![clip_image002[7] clip_image002[7]](https://advisoranalyst.com/wp-content/uploads/HLIC/28dc4fc690bc8b3bef38527f37938be3.png)
![clip_image002[9] clip_image002[9]](https://advisoranalyst.com/wp-content/uploads/HLIC/b39ed70e66219138d78a50dbff4fc29f.png)
