
by Cliff Stanton and Jeremy Frank, 361 Capital
August 2016
(top photo credit: Sports Illustrated)
Competition, Concentration and Capitulation
It’s been a challenging time in the alternative mutual fund space with far fewer fund launches year-to-date (18) than in the same time period in either of the prior two years. Further, net flows over the trailing twelve months ending in July have been negative in nine of the twelve Morningstar institutional categories that we track, with only the Managed Futures and Multialternative categories bringing in significant assets. This at a time when more and more big name investors – Soros, Icahn, Gundlach, Grant, Faber, Gross – are raising serious concerns over market conditions.
Unfortunately, investors tend to seek out volatility reducing and hedging strategies only after markets turn south. So it’s no surprise that contributing to the negative flows are the fact that both equity and bond markets have generated solid returns thus far this year, and that active management more generally has been losing to passive options. In fact, data from Morningstar shows that over the year ending in July, actively managed mutual funds experienced outflows of about $317 billion, while passive funds and ETFs had inflows of approximately $409 billion.
With fewer new funds to compete against, and track records of established players finally reaching the all-important three- and five-year marks, many of the alternative mutual fund categories are seeing increased concentration at the top and life boats being deployed at the bottom. As we compete within the alternative space, we were curious just how competition has affected concentration and capitulation, as the big get bigger and the small disappear. With that in mind, we looked at all mutual fund categories in Morningstar, both alternative and traditional, and asked the question, what percentage of the top funds in each category controlled 80% of the assets? We should have known that the inevitability of the 80/20 rule would rule the day. Across all mutual funds, we found that on average, the top 21% of funds in each category control roughly 80% of the assets.
But within the alternative categories, this concentration was considerably higher than average, as follows:
• Bear Market: 7.4% of the funds control 80% of the assets
• Long/Short Credit: 11.1% of the funds control 80% of the assets
• Long/Short Equity: 13.2% of the funds control 80% of the assets
• Managed Futures: 14.5% of the funds control 80% of the assets
• Market Neutral: 24.5% of the funds control 80% of the assets
• Multialternative: 18.3% of the funds control 80% of the assets
• Multicurrency: 13.3% of the funds control 80% of the assets
• Option Writing: 6.7% of the funds control 80% of the assets
As you can see, only Market Neutral is less top heavy than the average mutual fund category. Beneath these averages lies another truth, that a few select firms have amassed tremendous market share in certain categories.
This is all well and good, but what does it mean and why should advisors care? Our cursory examination didn’t attempt to divine cause; the narrow market leadership we identified could be a function of quality, cost, brand, or distribution efforts, to name a few. But it does mean that from a diligence standpoint, advisors need to consider the impact on performance of large asset bases, and should be asking the hard questions about capacity, as we’ve all seen this movie before. In addition, as the small funds fail to grow and increasingly throw in the towel, their departures will have an impact on the peer group rankings of those remaining. Assuming that the funds that are disappearing are due to poor performance, that puts a downward bias on the percentile rankings of remaining funds, and in categories that are generally smaller than traditional categories, a few dropouts can have a meaningful effect, as we cover below in our education section. With that in mind, advisors need to be aware that especially in the alternatives space, where risk exposures are far less understood and less static, that relying on peer group rankings as opposed to risk-adjusted return metrics can be problematic.
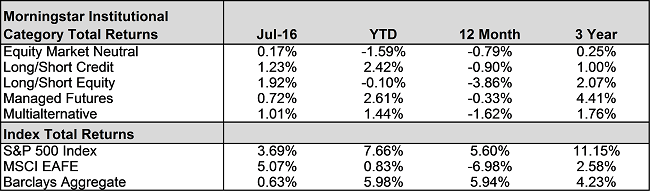
Equity markets produced strong gains during the month, as did most alternative categories. Given the earnings in global equity markets, it is no surprise that long/short equity had the best performance in July, earning 1.92%. However, the category is still down year to date and over the last 12 months. In fact, the last 12 months has been tough for every category as the best performing strategy, managed futures, is down 0.33%. Longer term, every strategy is positive, with managed futures also at the top of the list with 4.41% annualized returns.

Managed futures was, once again, the only strategy to show positive flows during July, bringing in over $1 billion in net assets for the month. As has been the case most of the year, the vast majority of the flows ($900 million) went to the largest fund in the category. In fact, this fund now accounts for nearly 50% of the total assets in the managed futures category. Long/short equity saw the largest outflows during the month, shedding nearly $1.1 billion in assets.

Hedge Fund Titans Struggle
Two of the industry’s biggest names, Brevan Howard and Tudor Investment Corp., are seeing large redemptions as they have struggled to perform in recent years. Brevan Howard is on pace for its third straight losing year. They have seen more than $3 billion in redemptions in 2016, bringing assets to $19.4 billion, down from $42 billion two years ago. Tudor’s assets are down from $14 billion to $11 billion over the same timeframe. In an attempt to improve performance, Tudor is looking at moving towards quantitative strategies. Additionally, they just announced that they were letting go of 15% of their workforce. It is always a tough call when strategies from clearly smart investors, that have worked so well for so long, begin to show signs of underperformance, but the contrarian in me tends to expect mean reversion and wants to see this as an opportunity. Unfortunately, as we have mentioned before, investors tend to have very short memories and make decisions on very short timeframes, so unless performance reverts quickly, Brevan Howard, Tudor and many other large, accomplished hedge funds are likely to see the trend of shrinking asset bases.

Alternative “Alternative” Investments Going Mainstream
From WealthManagement.com:
Alternative investments such as a Ferrari 335 S Scaglietti, a rare blue diamond or a case of Romanee-Conti Grand Cru wine from Burgundy are going mainstream as investors grapple with ultra-low interest rates and volatile stocks. Spooked by the end of a 30-year bond bull run and bouts of money printing which have pushed stock values out of kilter with economic reality, high-profile investors are turning to fine wines, classic cars and jewels, research and index data show.

The Next Big Short, Hedge Fund Fees?
Given the low performance and substantial outflows within the hedge fund industry it’s no surprise that fees are continuing to come under pressure. Steve Eisman, of “The Big Short” fame, thinks the next big short is hedge fund fees. He’s out in front of it with his Neuberger Berman long/short strategy, only charging a flat 1.25% in fees. Given the proliferation of liquid alternative products, this trend is likely to continue.
Education

Survivorship Bias
Whenever an investor is utilizing a database of investments to aid in their due diligence process they must be careful to understand the impact of survivorship bias. For example, if an investor were to look at the current funds in a given category/strategy and calculate the average 3-year return for those funds that have survived over that timeframe they would probably be overstating the returns of the category. This is because there will be funds that were around 3 years ago that did not survive the entire time period and usually those funds that did not survive had poor performance; therefore, not including them in a return calculation creates an upward bias for the category, a clear definition of “survivorship bias.”
Most databases attempt to minimize this type of bias by calculating and reporting returns monthly, using funds that were active during that month. This leads to more accurate reporting of strategy returns, though it still has drawbacks. For self-reporting databases (which most hedge fund databases are) funds simply quit reporting when they have poor performance, giving a distorted and biased view of overall category performance. With a database of public funds this is not a problem, though mid-month closures can cause some bias.
However, a subtler form of survivorship bias takes place when looking at peer group rankings. In our experience, it is unusual for a database provider to calculate their percentile rankings in a way that is free of survivorship bias. To take an extreme example, imagine a universe that begins with 10 funds. During a 3-year period five of the funds have poor performance and close and five have strong performance and survive. Doing a peer analysis over that timeframe will show the fund with the worst performance of the surviving funds, but still much better performance than the closed funds, to have been in the 80th percentile. This despite the fact it actually outperformed five of the 10 funds. Some databases score funds based on this biased universe and would give that fund a very low rating even though it did well compared to the entire universe of funds in the category. In addition, certain databases are very influential to potential investors and a low rating could significantly hamper fund raising or asset retention for this hypothetical fund.
The key point is that investors need to understand how survivorship bias is being introduced and what impact it is having on their analysis. As was mentioned in our introduction, this is especially true when looking at alternative categories, which tend to be smaller and therefore impacted much more by fund closures. Simple peer rankings or comparison to a category average return is likely to present a distorted picture which, without doing deeper analysis, could lead to ill-informed conclusions.
And Lastly
Hedge Funds Gone Wild in the Hamptons
Unfortunately, some hedge funds are working hard this summer to keep the Wolf of Wall Street stereotype alive. Here and here.

Copyright © 361 Capital