by Don Vialoux, Timingthemarket.ca
Editor’s Note: Next Tech Talk report will be released on Tuesday
Observations
Economic data points released yesterday waved a cautious sign. Consensus for August ISM was 52.2 versus 52.6 in July. Actual was 49.4. Consensus for July Construction was an increase of 0.6% versus a 0.6% decline in June. Actual was unchanged. Consensus for U.S. August auto sales was unchanged from July. Actual was declines by most producers. Another important data point is released this morning, the August employment report. Consensus for Non-farm Payrolls is 180,000.
StockTwits Released Yesterday
S&P 500 Index has declined 56% of Septembers averaging a loss of 0.6%.
Technical action by S&P 500 stocks to 10:00: Mixed. Breakouts:$CBG, $ICE, $CHRW, $INTC. Breakdowns: $CPB, $ADI, $CRM, $ES
Editor’s Note: After 10:00 AM EDT, the following stocks broke intermediate support: AES, CAT, GE, DHI, MYL, FTR and DUK. HPE broke intermediate resistance.
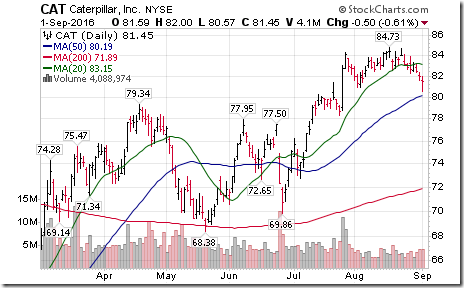
Caterpillar $CAT, a Dow Jones Industrial Average stock broke support at $80.92 completing double top pattern
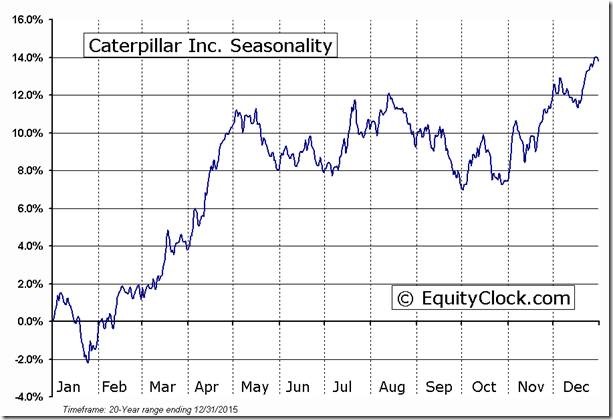
‘Tis the season for weakness in Caterpillar $CAT until early October.
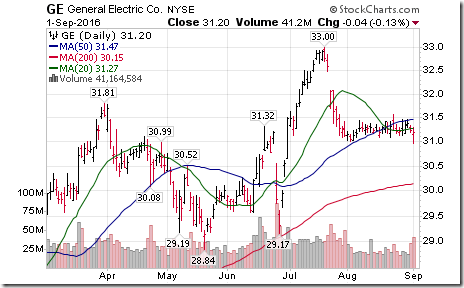
General Electric $GE, a Dow Jones Industrial Average stock broke $31.00 establishing an intermediate downtrend.
Trader’s Corner
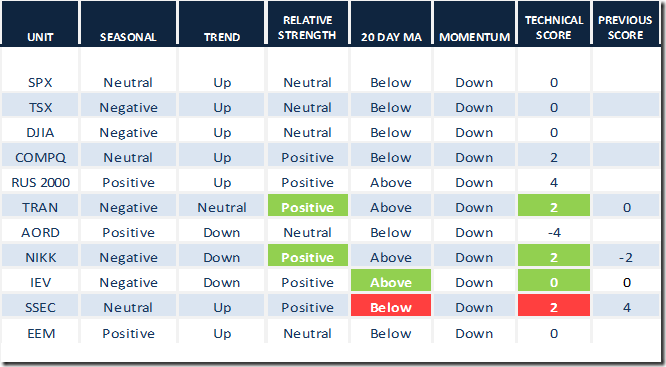
Daily Seasonal/Technical Equity Trends for September 1st 2016
Green: Increase from previous day
Red: Decrease from previous day
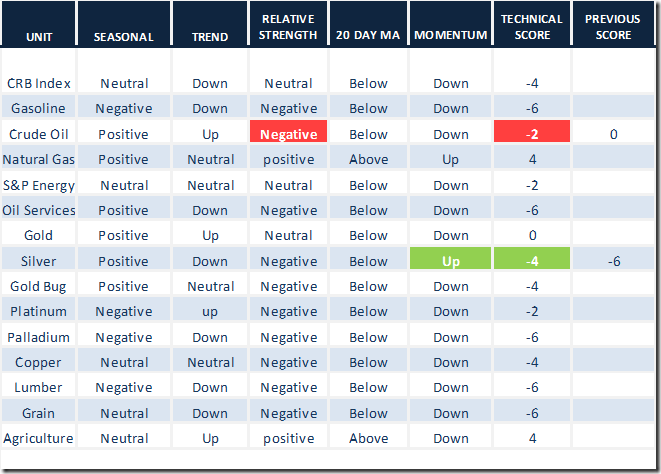
Daily Seasonal/Technical Commodities Trends for September 1st 2016
Green: Increase from previous day
Red: Decrease from previous day
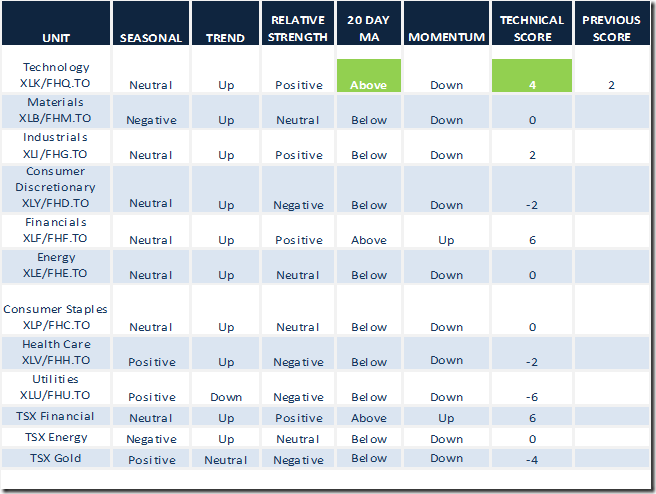
Daily Seasonal/Technical Sector Trends for September 1st 2016
Green: Increase from previous day
Red: Decrease from previous day
Special Free Services available through www.equityclock.com
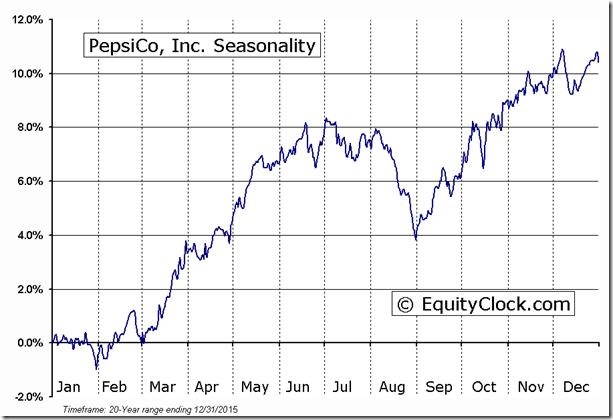
Equityclock.com is offering free access to a data base showing seasonal studies on individual stocks and sectors. The data base holds seasonality studies on over 1000 big and moderate cap securities and indices. To login, simply go to http://www.equityclock.com/charts/ Following is an example:
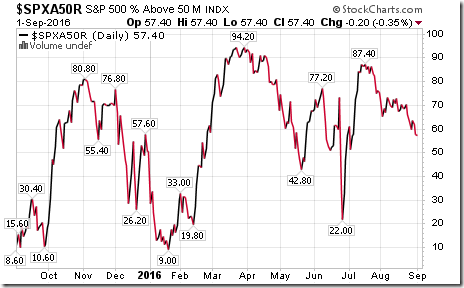
S&P 500 Momentum Barometer
The Barometer slipped another 0.20 to 57.40. It remains intermediate overbought and trending down.
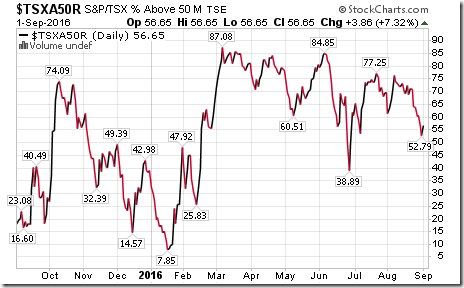
TSX Momentum Barometer
The Barometer added 3.86 to 56.65. It remains intermediate overbought and trending down.
Disclaimer: Seasonality and technical ratings offered in this report by www.timingthemarket.ca and www.equityclock.com are for information only. They should not be considered as advice to purchase or to sell mentioned securities. Data offered in this report is believed to be accurate, but is not guaranteed
Copyright © DV Tech Talk, Timingthemarket.ca


