by LPL Research
Friday might not have felt like much, as the S&P 500 dropped 0.2% for the day – but it did trade in a daily range of 1.3%, which was the largest daily intraday range since and the post-Brexit volatility in late June. To put that in perspective, 29 of the first 30 days this year traded in a range larger than Friday’s.
Also, Friday marked the first three-day losing streak for the S&P 500 in 50 days, the longest streak without three red days in a row since 57 in a row during the summer of 2014 (ending in early September). Then looking only at daily closes, the S&P 500 hasn’t added or lost more than 1% for 35 straight days (today could be 36), the longest streak without a 1% move since 62 in a row during the summer of 2014 (ending in mid-July).
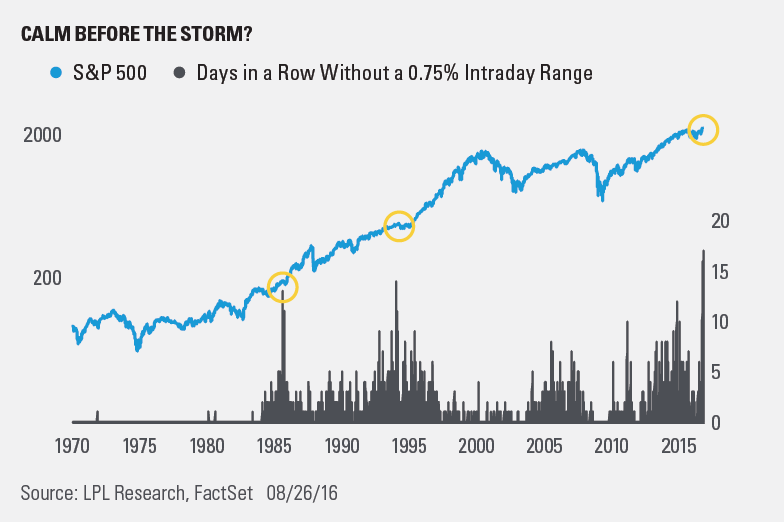
Bloomberg noted today that going back 30 days, the S&P 500 has traded in a range of 1.5%, the smallest range since 1965. Taking a closer look at intraday moves, Friday marked the end of a record 17 straight days of an intraday range of less than 0.75%. Using data back to 1970, this was the longest streak ever and incredibly the second longest streak of 16 straight days took place only a month ago. So going back 45 years, over the past seven weeks, the two longest streaks without an intraday move of more than 0.75% have taken place. The two previous longest streaks were in July 1985 (15 days) and December 1994 (14 days).
What does this all mean? The bottom line is the lack of volatility we’ve seen lately is truly historic. It is important to note though that it won’t stay this way forever. Non-volatile times eventually transition to volatile times—this has happened throughout market history and we expect it will continue to happen. Then don’t forget that September and October, two of the most volatile months, are on tap. Although we do expect volatitly to heat up later this year, it is important to note this isn’t a reason to panic—as this volatility is actually perfectly normal.
Copyright © LPL Research


