


Crude Oil: Bullish Bottom
by Carl Swenlin, Stockcharts.com
In the last week a bullish reverse head and shoulders pattern has emerged on the crude oil chart. Also, the PMO generated a crossover BUY signal as it crossed up through its signal line, increasing, in my opinion, the odds that price will penetrate the neckline.
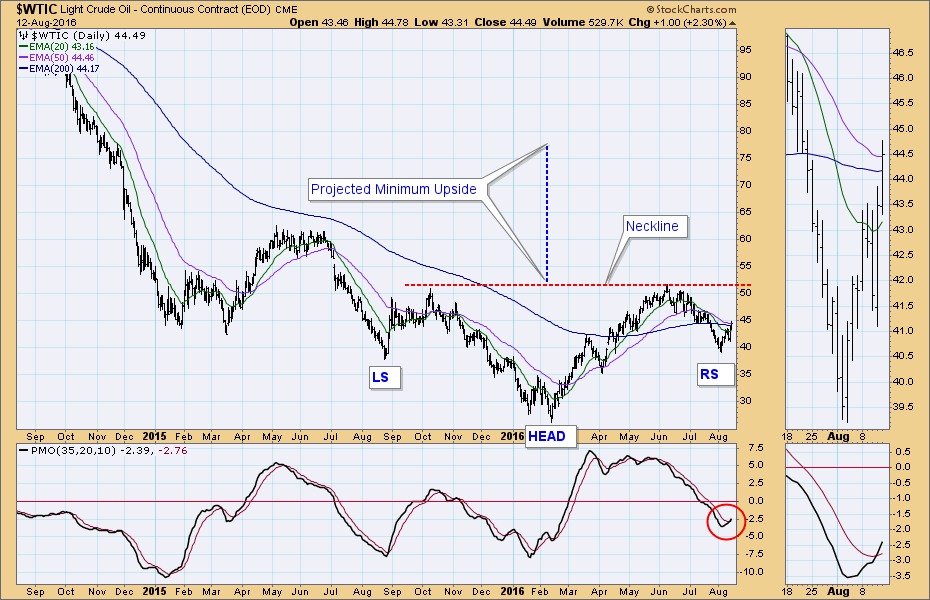
If the neckline is penetrated, the minimum upside target is equal to the distance between the head and the neckline. In this case that is about 77.50, but I think that is a little too ambitious based upon other considerations. On the chart below we can see an horizontal resistance line drawn across the 2015 top at around 62.00. Just above that is a zone of resistance beginning at about 70.00.
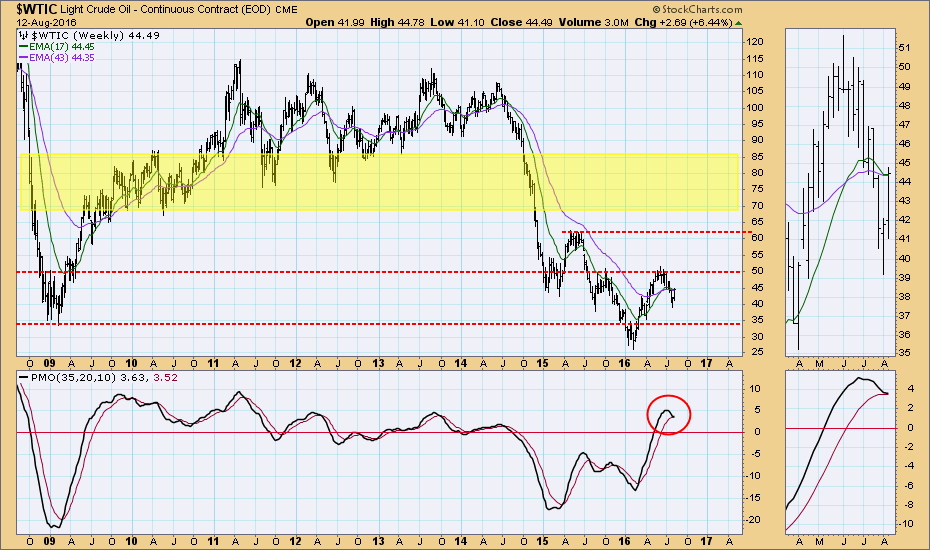 As for positive evidence, the weekly PMO appears ready to bottom right on the signal line. Also, the weekly EMAs are signaling for higher prices, with the 17EMA bottoming just above the 43EMA.
Looking at the price highs earlier in the decade, one might conclude that an upside target above 100.00 might be attainable; however, the supply/demand equation has changed radically since those good old days. Something unexpected would need to happen to overcome this fundamental barrier.
CONCLUSION: A bullish reverse head and shoulders pattern has formed on the crude oil chart. Other positive technicals make me think that the pattern will probably execute, with price breaking above the neckline. However, I don't think that price will make the minimum upside target of 77.50 because of fundamental conditions and overhead resistance.