Welcome to the Most Boring Market in 21 Years
by LPL Research
The second half of July has historically been boring for equities. Considering the huge drop to start 2016 and big rebound in late February and March, then the Brexit 5% two-day drop and nearly just as quick recovery, the second half of July has been very quiet, as nearly all volatility has stopped. To show just how tough it has been for the S&P 500 to make a move, in the past 11 days the S&P 500 has alternated between higher and lower closes for just the fifth time since World War II.
Looking at the recent action, the S&P 500 hasn’t moved more than 0.75% (up or down) for 14 consecutive days. That is the longest such streak in 16 months. It hasn’t closed higher or lower by 0.5% for 10 straight days for just the third time the past 20 years. And the intra-day high and low range over the past 11 days has been only 0.92%, the tightest range ever in the 45 years of available data. Put it this way: 30 of the first 31 days in 2016 had a larger one day range (0.92%) than the past 11 days have had.
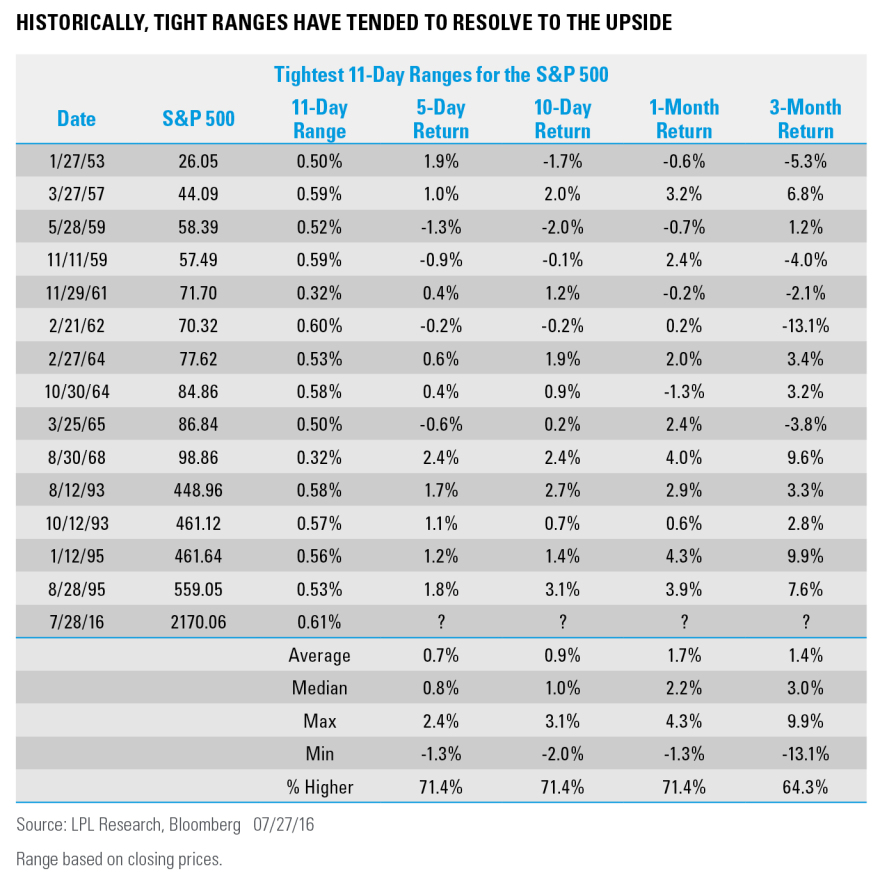
Digging into the past 11 trading sessions a little more, the S&P 500 close has moved in a range of only 0.61%. Take note, this isn’t using intra-day highs and lows over the past 11 days, just the past 11 closes. This is the tightest range since August 1995. Below we look at all the times there was an 11-day range tighter than the current 0.61%.
In conclusion, tight ranges don’t stay that way forever, just as volatile times don’t stay volatile forever. History would suggest that tight ranges like we are in now tend to resolve higher. Considering August and September are two of the most volatile and weakest months of the year, it will be quite interesting to see how this resolves.


