


Why You Might Worry About the Plunging Gold-Silver Ratio
by Jennifer Thomson, CFA, Gavekal Capital
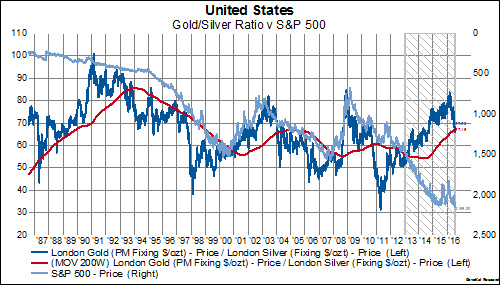
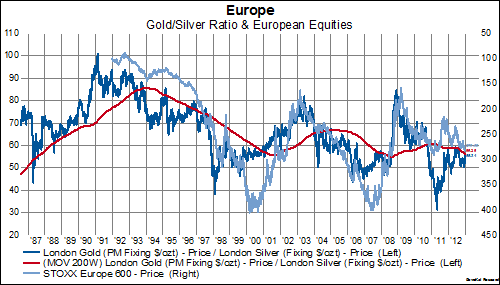
Over the last 30 years or so (up until early 2013), whenever the gold/silver ratio (dark blue line) reached a high and subsequently fell through its 200-week moving average (red line), equities (light blue line, inverted) tended to rally:
Over the last several years (shaded area in the chart below), however, this relationship seems to have broken down and completely reversed:
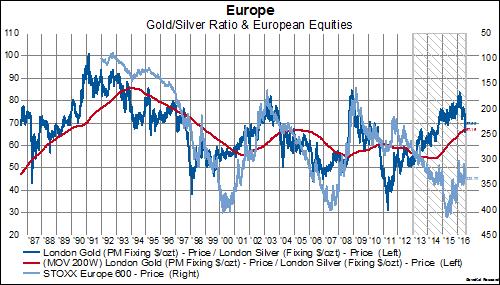
Since 2013, stocks continued to rally at the same time the gold/silver ratio rebounded– with both having since turned back to falling trends. Will the old relationship reassert itself, setting the stage for a rally in European stocks? Or is there a new trend in town? If so, we find ourselves wondering how much longer stocks in other regions can hold on to all-time highs: