by Don Vialoux, Timingthemarket.ca
Economic News This Week
June Housing Starts to be released at 8:30 AM EDT on Tuesday are expected to improve to 1,165,000 units from 1,164,000 units in May.
Weekly Initial Jobless Claims to be released at 8:30 AM EDT on Thursday are expected to increase to 265,000 from 254,000 last week.
July Philadelphia Fed Index to be released at 8:30 AM EDT on Thursday is expected to improve to 5.0 from 4.7 in June.
June Existing Home Sales to be released at 10:00 AM EDT on Thursday are expected to slip to 5,500,000 units from 5,530,000 units in May.
Canadian June Consumer Price Index to be released at 8:30 AM EDT on Friday is expected to increase 0.1% versus a gain of 0.4% in May. Excluding food and energy, June CPI is expected to decline 0.2% versus a gain of 0.3% in May.
Canadian May Retail Sales to be released at 8:30 AM EDT on Friday are expected to slip 0.2% versus a gain of 0.9% in April.
Earnings News This Week
The Bottom Line
Technical, seasonal and fundamental factors point to a strong possibility of start of an intermediate correction this week by equity markets and economic sensitive sectors. Traders and seasonal investors should respond accordingly.
Observations
Historically, an unexpected event (e.g. China blowing up last summer, ebola and Ukraine incidents in 2014, Greece blowing up in 2013) has occurred between the middle of June and the middle of October that triggered a significant increase in equity market volatility (and a corresponding correction). Could the failed attempted coup in Turkey be the event this summer?
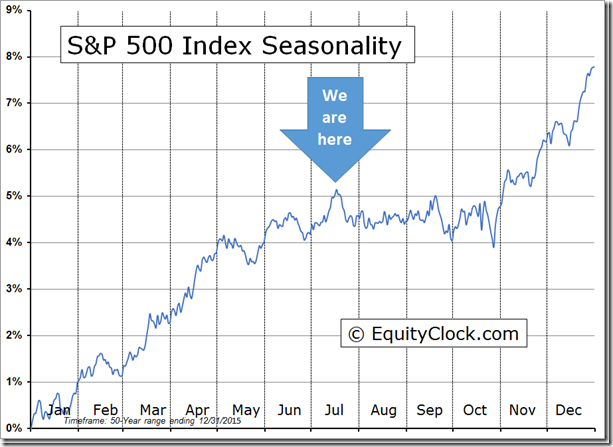
On average during the past 50 years, the S&P 500 Index has reached a seasonal summer peak on July 17th
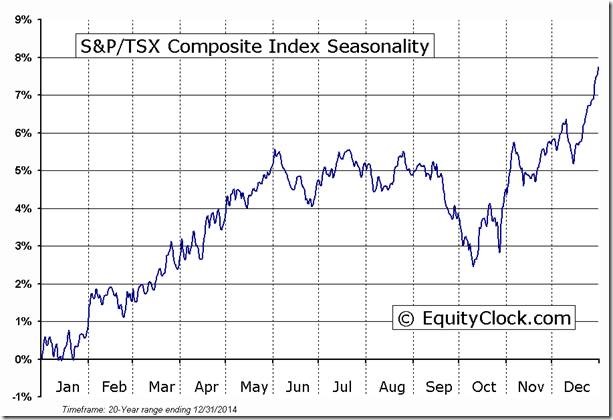
On average during the past 20 years, the TSX Composite has reached a summer peak on July 17th
Economic news this week is sparse and is unlikely to have a significant impact on equity markets. Next major economic event is the FOMC meeting to be held on July 26th -27th. No change in the Fed Fund rate is expected at the meeting, but recent economic data may prompt suggestions of an earlier increase than previously implied.
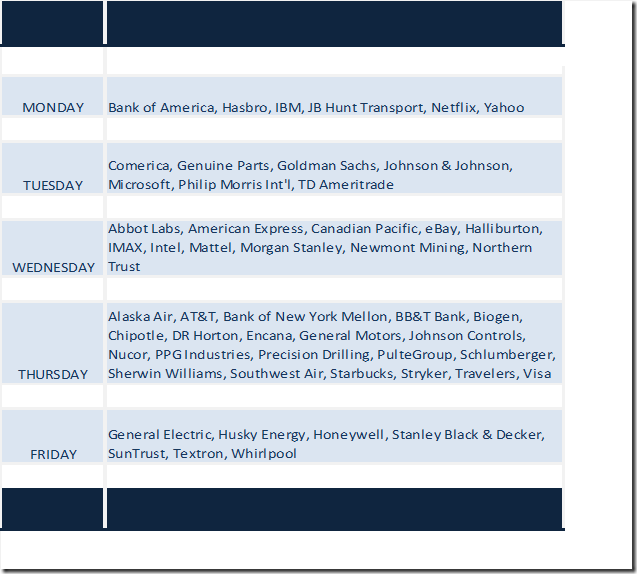
Second quarter reports are a focus this week. 35 S&P 500 companies have reported to date with mixed earnings and revenue results. 140 S&P 500 companies are scheduled to report this week (including 11 Dow Industrial Average companies). Focus is on industrial and technology reports. Consensus calls for a 5.5% earnings decline and 0.6% revenue decline on a year-over-year basis. 81 S&P 500 companies have announced negative second quarter guidance and 32 companies have announced positive second quarter guidance.
Second quarter reports by Canadian companies start to dribble in this week. Historically, major Canadian companies begin reporting in the fourth week in July. Year-over-year earnings by major companies on average (median) are expected to be flat.
Prospects beyond the second quarter remain positive, but have been diminished. According to FactSet, S&P 500 earnings on a year-over-year basis are expected to increase by 0.4% in the third quarter and 6.9% in the fourth quarter. Revenues are expected to increase 2.2% in the third quarter and 4.9% in the fourth quarter.
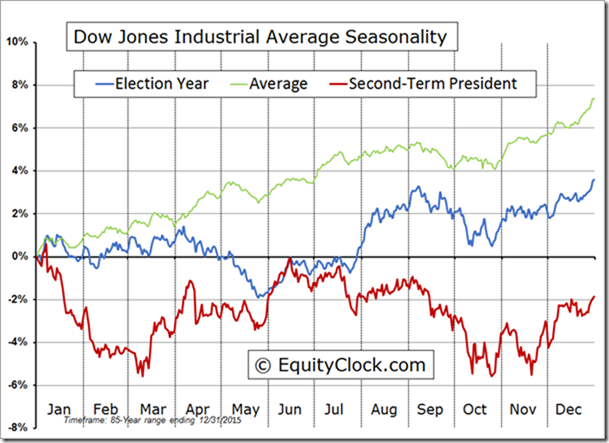
Historically, the Dow Jones Industrial Average during the year when a new U.S. President is elected after two terms has a correction starting in the third week in July (when party conventions are held) lasting until mid-October.
Short and intermediate technical indicators for most equity market indices and economic sensitive sectors are overbought, but have yet to show signs of peaking.
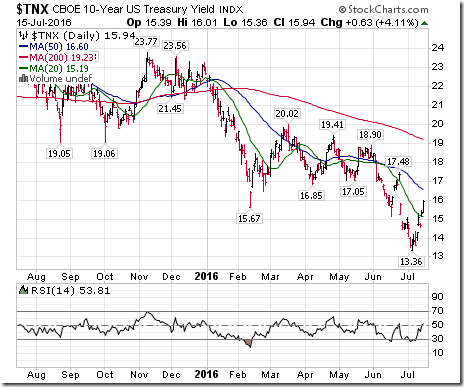
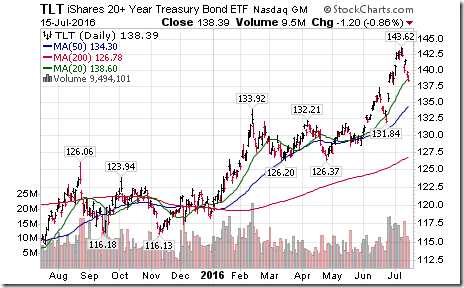
In contrast, price on U.S. Treasuries and interest sensitive equities have shown convincing signs of reaching an intermediate peak. Short term momentum indicators for the price of long term Treasuries (e.g. TLT) have rolled over. Higher interest rates are not good for equity prices.
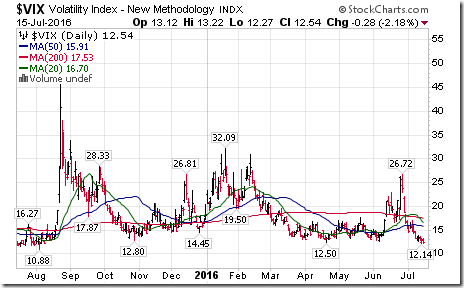
The VIX Index is a key indicator to watch. A spike from current levels during the summer indicates the start of an intermediate correction. Currently, VIX is near a one year low.
Equity Indices and Related ETFs
Daily Seasonal/Technical Equity Trends for July 15th 2016
Green: Increase from previous day
Red: Decrease from previous day
Calculating Technical Scores
Technical scores are calculated as follows:
Intermediate Uptrend based on at least 20 trading days: Score 2
Higher highs and higher lows
Intermediate Neutral trend: Score 0
Not up or down
Intermediate Downtrend: Score -2
Lower highs and lower lows
Outperformance relative to the S&P 500 Index: Score: 2
Neutral Performance relative to the S&P 500 Index: 0
Underperformance relative to the S&P 500 Index: Score –2
Above 20 day moving average: Score 1
At 20 day moving average: Score: 0
Below 20 day moving average: –1
Up trending momentum indicators (Daily Stochastics, RSI and MACD): 1
Mixed momentum indicators: 0
Down trending momentum indicators: –1
Technical scores range from -6 to +6. Technical buy signals based on the above guidelines start when a security advances to at least 0.0, but preferably 2.0 or higher. Technical sell/short signals start when a security descends to 0, but preferably -2.0 or lower.
Long positions require maintaining a technical score of -2.0 or higher. Conversely, a short position requires maintaining a technical score of +2.0 or lower.
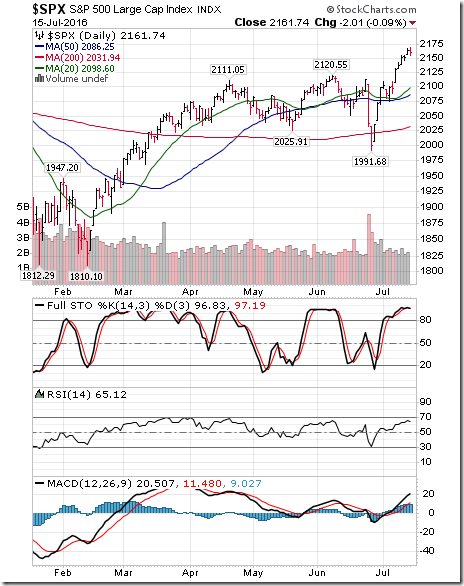
The S&P 500 Index gained 31.84 points (1.29%) last week. Intermediate trend remains up with the Index at an all-time high. The Index remains above its 20 day moving average. Short term momentum indicators are trending up and are overbought, but have yet to show signs of peaking.
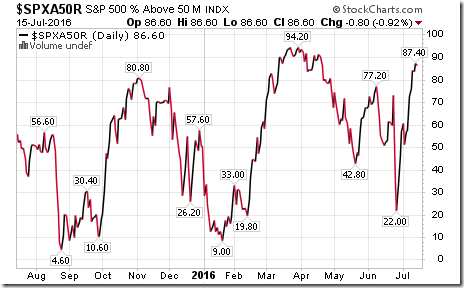
Percent of S&P 500 stocks trading above their 50 day moving average (Also known as the S&P 500 Momentum Barometer) increased last week to 86.60% from 72.55%. Percent is intermediate overbought, but has yet to show signs of peaking.
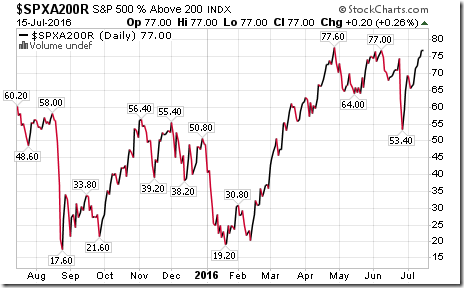
Percent of S&P 500 stocks trading above their 200 day moving average increased last week to 77.00% from 71.54%. Percent remains intermediate overbought, but has yet to show signs of peaking.
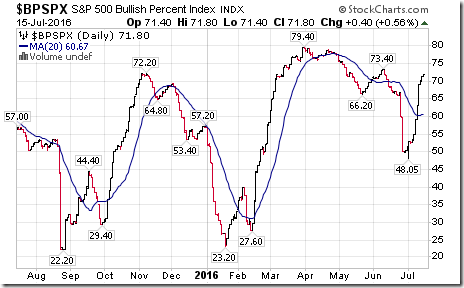
Bullish Percent Index for S&P 500 stocks increased last week to 71.80% from 59.20% and moved above its 20 day moving average. The Index remains intermediate overbought, but has yet to show signs of peaking.
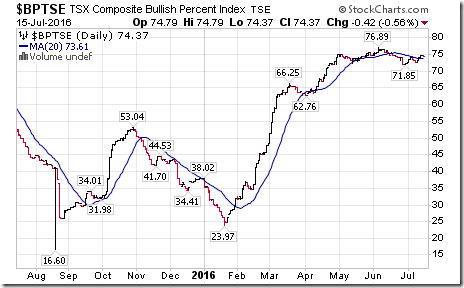
Bullish Percent Index for TSX Composite stock increased last week to 74.37% from 72.69% and moved above its 20 day moving average. The Index remains intermediate overbought.
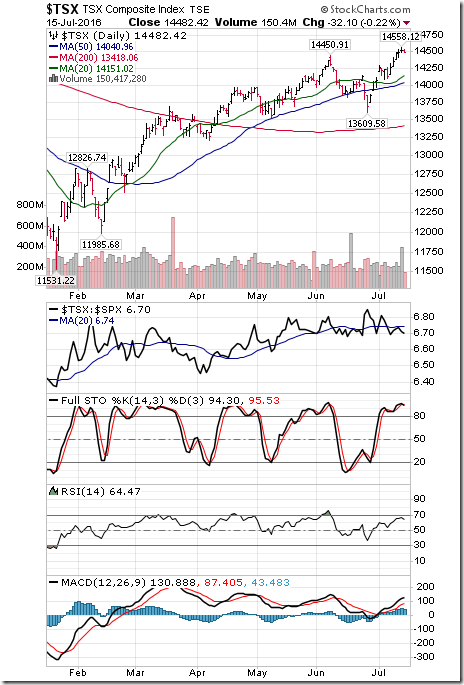
The TSX Composite Index gained 222.58 points (1.56%) last week. Intermediate uptrend was confirmed on a move above 14,450.91 (Score: 2). Strength relative to the S&P 500 Index remains neutral (Score: 0). The Index remains above its 20 day moving average (Score: 1). Short term momentum indicators are trending up (Score: 1) and overbought, but have yet to show signs of peaking. Technical score last week remained at 4.
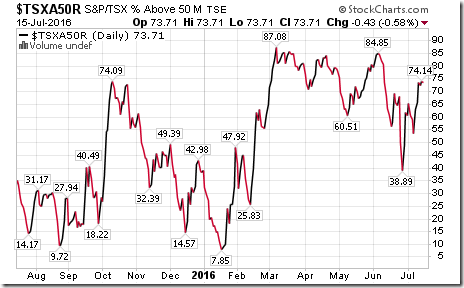
Percent of TSX stocks trading above their 50 day moving average (Also known as the TSX Momentum Barometer) increased last week to 73.71% from 63.09%. Percent remains intermediate overbought, but has yet to show signs of peaking.
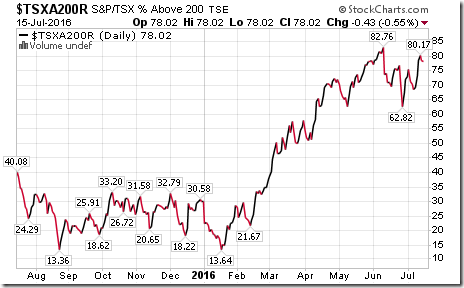
Percent of TSX stocks trading above their 200 day moving average increased last week to 78.02% from 69.10%. Percent remains intermediate overbought.
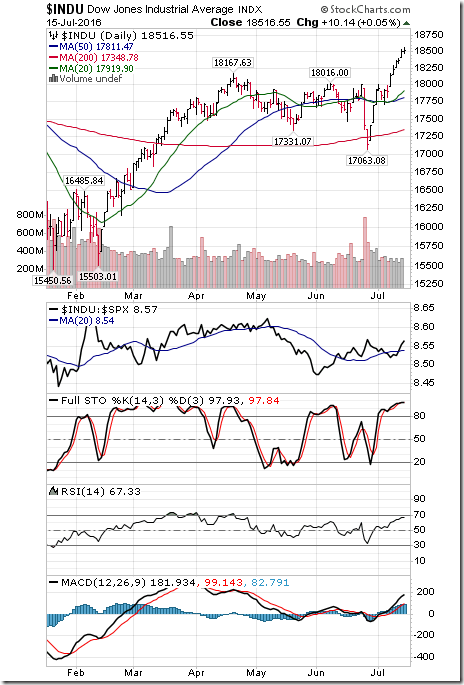
The Dow Jones Industrial Average added 369.81 points (2.04%) last week. Intermediate trend changed last week to up from neutral when the Average moved above 18,167.63 to an all-time high. Strength relative to the S&P 500 Index remained neutral. The Average remains above its 20 day moving average. Short term momentum indicators are trending up and are overbought, but have yet to show signs of peaking. Technical score increased last week to 4 from 2.
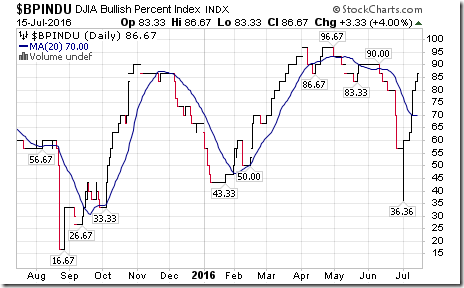
Bullish Percent Index for Dow Jones Industrial Average stocks increased last week to 86.67% from 63.33% and moved above its 20 day moving average. The Index remains intermediate overbought, but has yet to show signs of peaking.
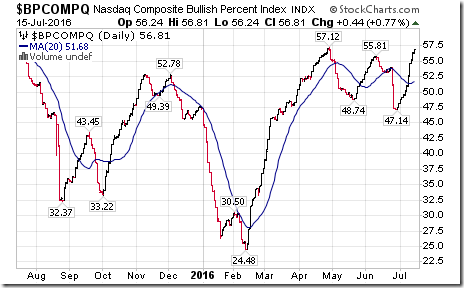
Bullish Percent Index for NASDAQ Composite stocks increased last week to 56.81% from 51.13% and moved above its 20 day moving average. The Index remains intermediate overbought, but has yet to show signs of peaking.
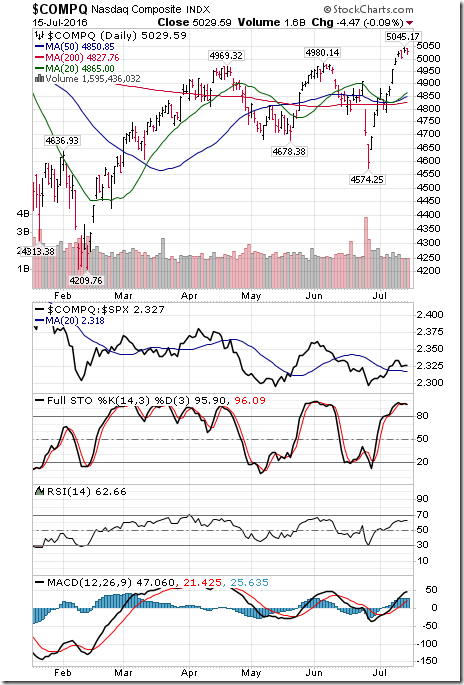
The NASDAQ Composite Index gained 72.83 points (1.47%) last week. Intermediate trend changed to up from neutral on a move above 4,980.14. Strength relative to the S&P 500 Index improved last week to positive from neutral. The Index remains above its 20 day moving average. Short term momentum indicators are trending up and are overbought, but have yet to show signs of peaking. Technical score improved last week to 6 from 2.
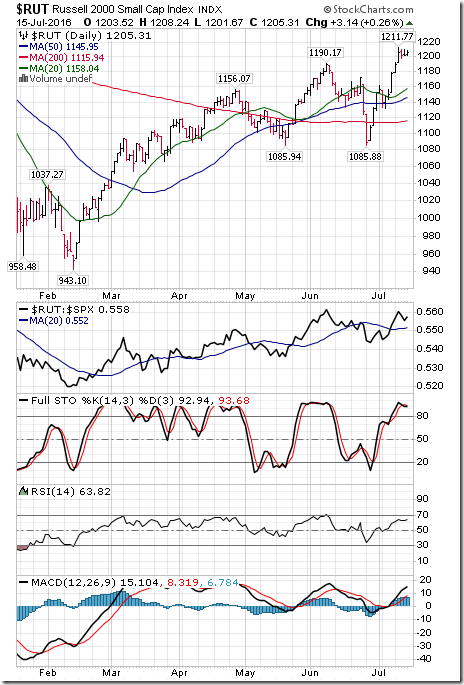
The Russell 2000 Index gained 27.95 points (2.37%) last week. Intermediate trend changed to up from neutral last week on a move above 1,190.17. Strength relative to the S&P 500 Index changed to positive from neutral. The Index remains above its 20 day moving average. Short term momentum indicators are trending up and are overbought, but have yet to show signs of peaking. Technical score increased last week to 6 from 2.
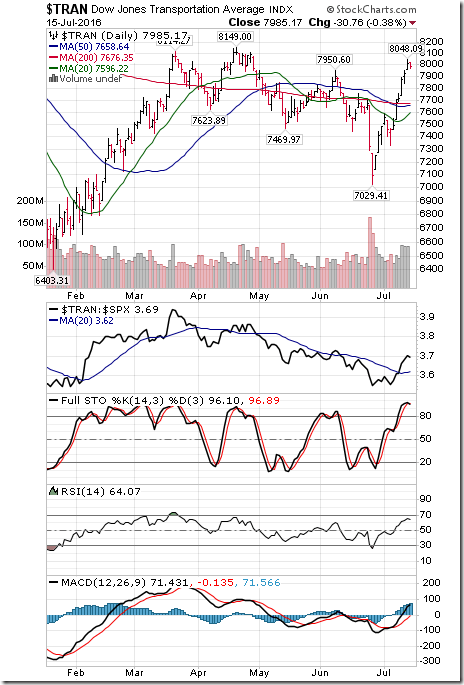
The Dow Jones Transportation Average gained 301.89 points (3.93%) last week. Intermediate trend changed to neutral from down on a move above 7,950.60. Strength relative to the S&P 500 Index changed to positive from negative. The Average remains above its 20 day moving average. Short term momentum indicators are trending up and are overbought, but have yet to show signs of peaking. Technical score increased last week to 4 from -2
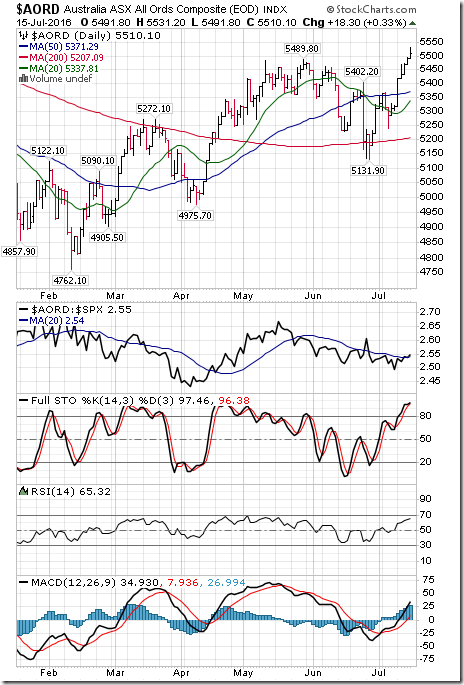
The Australia All Ordinaries Composite Index gained 194.50 points (3.66%) last week. Intermediate uptrend was confirmed on a move above 5,489.80. Strength relative to the S&P 500 Index changed to neutral from negative. The Index remains above its 20 day moving average. Short term momentum indicators are trending up and are overbought, but have yet to show signs of a peak.
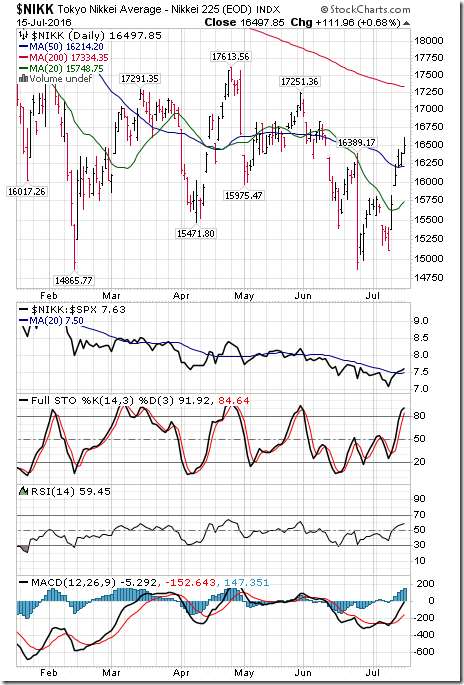
The Nikkei Average jumped 1,390.87 points (9.21%) last week. Intermediate trend remains down. Strength relative to the S&P 500 Index changed to neutral from negative last week. The Average moved above its 20 day moving averages. Short term momentum indicators are trending up and are overbought, but have yet to show signs of peaking. Technical score increased last week to 0 from-6.
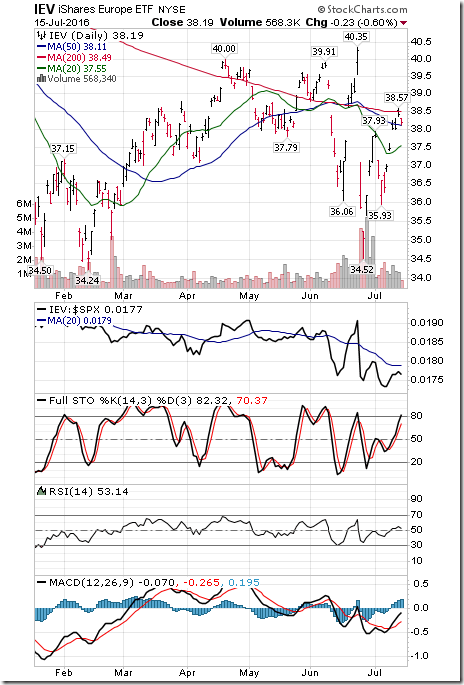
Europe iShares gained $1.24 (3.36%) last week. Intermediate trend remains down. Strength relative to the S&P 500 Index remains negative. Units moved above their 20 day moving average. Short term momentum indicators are trending up. Technical score increased last week to -2 from -6.
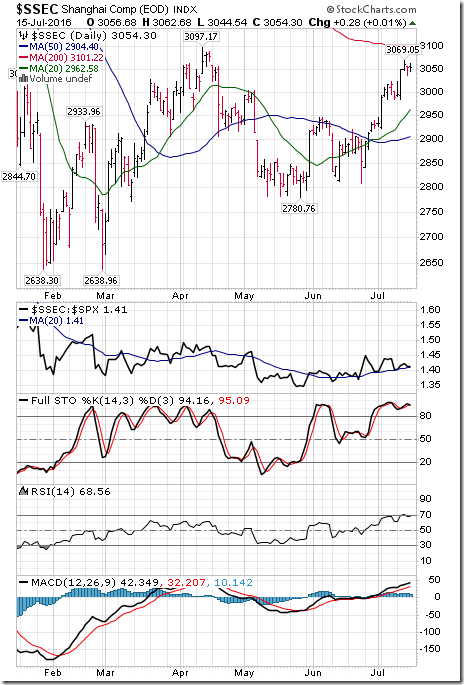
The Shanghai Composite Index gained another 66.21 points (2.22%) last week. Intermediate trend remains up. Strength relative to the S&P 500 Index remains positive. The Index remains above its 20 day moving average. Short term momentum indicators are trending up and are overbought, but have yet to show signs of peaking.
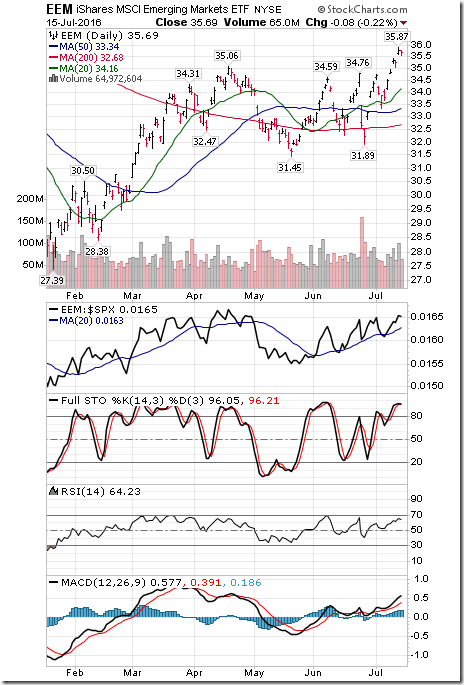
Emerging Markets iShares gained another $1.19 (3.45%) last week. Intermediate uptrend was confirmed on a move above $35.06. Strength relative to the S&P 500 Index remains positive. Units remain above their 20 day moving average. Short term momentum indicators are trending up and are overbought, but have yet to show signs of peaking.
Currencies
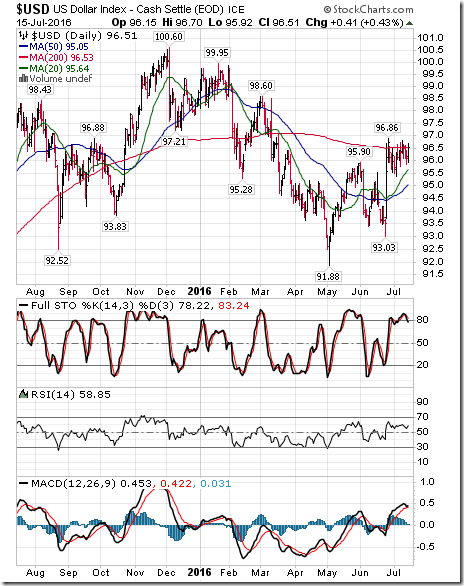
The U.S. Dollar added 0.22 (0.23%) last week. Intermediate trend remains up. The Index remains above its 20 day moving average. Short term momentum indicators are trending up and are overbought, but showing early signs of peaking.
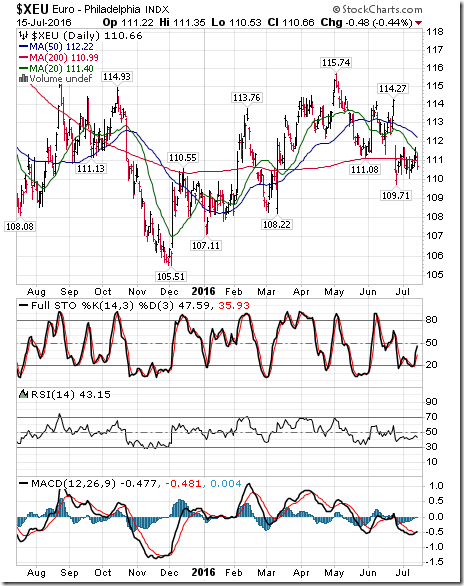
The Euro added 0.12 (0.11%) last week. Intermediate trend remains down. The Euro remains below its20 day moving average. Short term momentum indicators are mixed.
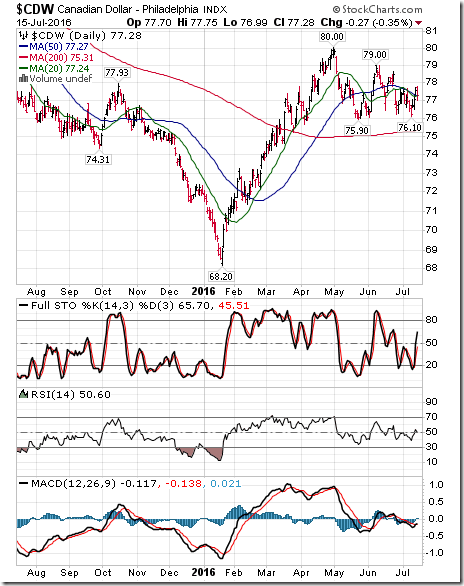
The Canadian Dollar gained US 0.59 to (0.77%) last week. Intermediate trend remains up. The Canuck Buck moved back above its 20 day moving average. Short term momentum indicators are trending up
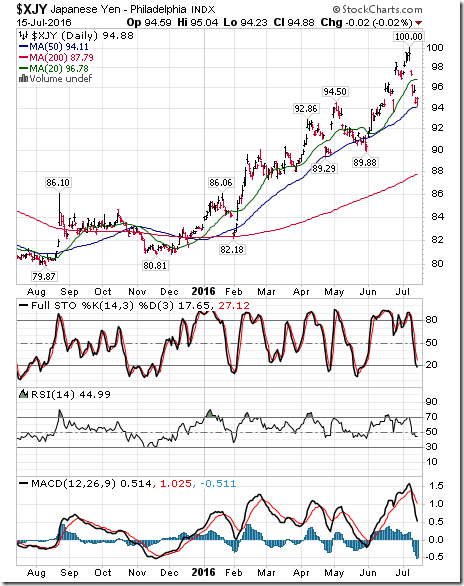
The Japanese Yen plunged 4.66 (4.68%) last week. Intermediate trend remains up. The Yen dropped below its 20 day moving average. Short term momentum indicators are trending down.
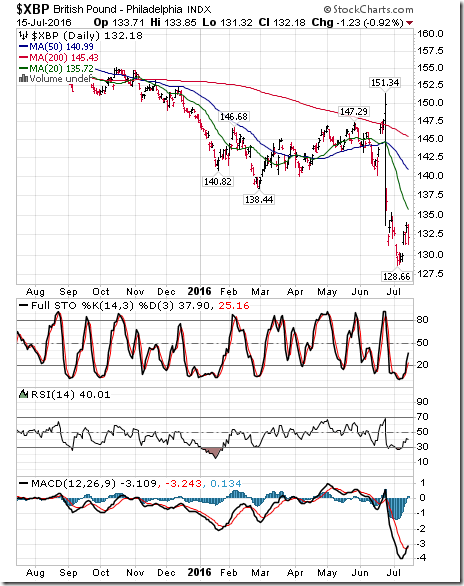
The British Pound gained 2.65 (2.01%) last week. Intermediate trend remains down. The Pound remains below its 20 day moving average. Short term momentum indicators are trending up.
Commodities
Daily Seasonal/Technical Commodities Trends for July 15th 2016
Green: Increase from previous day
Red: Decrease from previous day
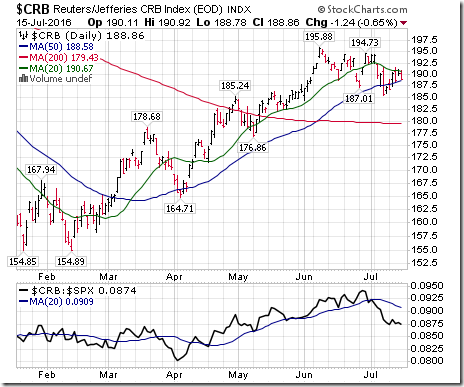
The CRB Index gained 1.69 (0.90%) last week. Intermediate trend remains down. Strength relative to the S&P 500 Index remains negative. The Index remained below its 20 day moving average. Short term momentum indicators are trending up. Technical score improved last week to -4 from -6.
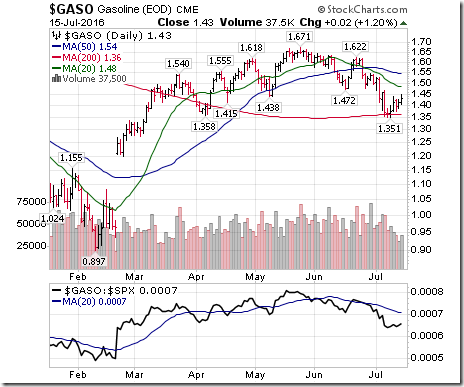
Gasoline gained $0.06 per gallon (4.38%) last week. Intermediate trend remains down. Strength relative to the S&P 500 Index remains negative. Gas remains below its 20 day moving average. Short term momentum indicators are trending up. Technical score improved to -4 from -6.
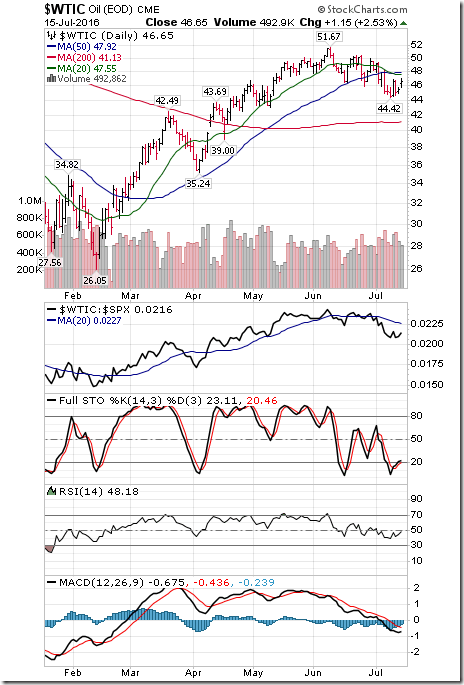
Crude Oil added $1.24 per barrel (2.73%) last week. Intermediate trend remains up. Strength relative to the S&P 500 Index remains negative. Crude remains below its 20 day moving average. Short term momentum indicators turned upward on Friday. Technical score improved last week to 0 from 2.
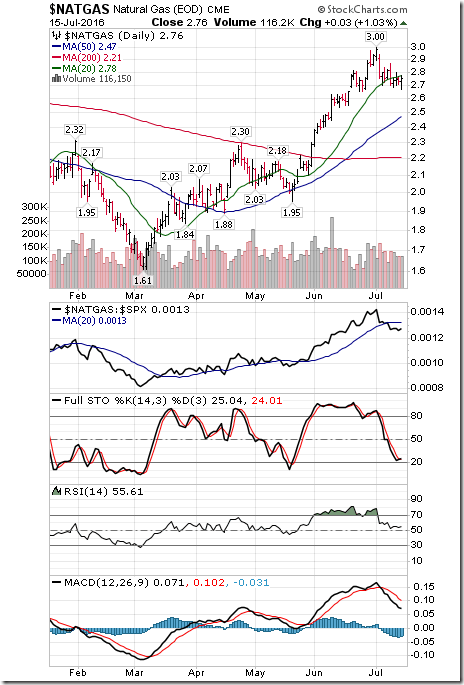
Natural Gas slipped $0.05 per MBtu (1.79%) last week. Intermediate trend remains up. Strength relative to the S&P 500 Index remains negative. “Natty” remains moved below its 20 day moving average. Short term momentum indicators are trending down. Technical score dropped last week to -2 from 4.
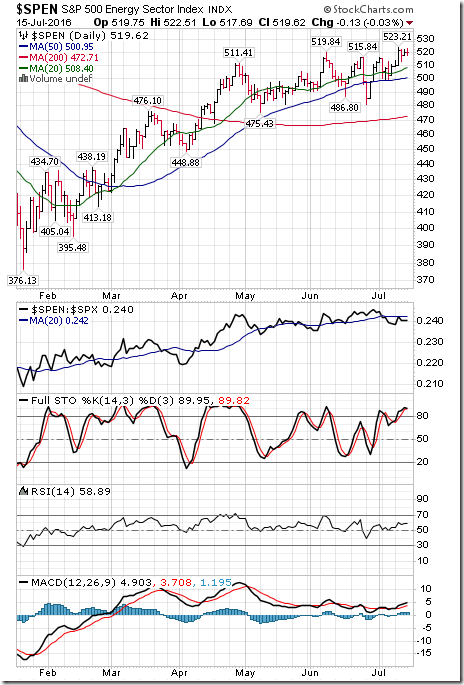
The S&P Energy Index gained 10.61 points (2.08%) last week. Intermediate uptrend was confirmed on a move above 519.84. Strength relative to the S&P 500 Index changed to negative from neutral. The Index remained above its 20 day moving average. Short term momentum indicators are trending up. Technical score remained last week at 2.
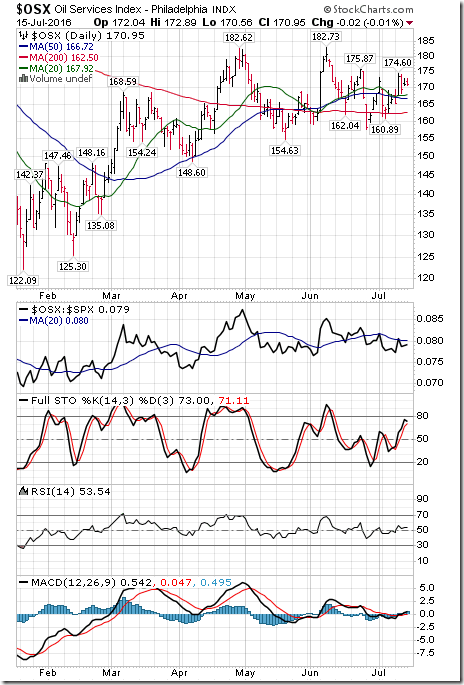
The Philadelphia Oil Services Index gained 4.41 points (2.65%) last week. Intermediate trend remains up. Strength relative to the S&P 500 Index remains negative. The Index moved above its 20 day moving average. Short term momentum indicators are trending up. Technical score improved last week to 2 from -2.
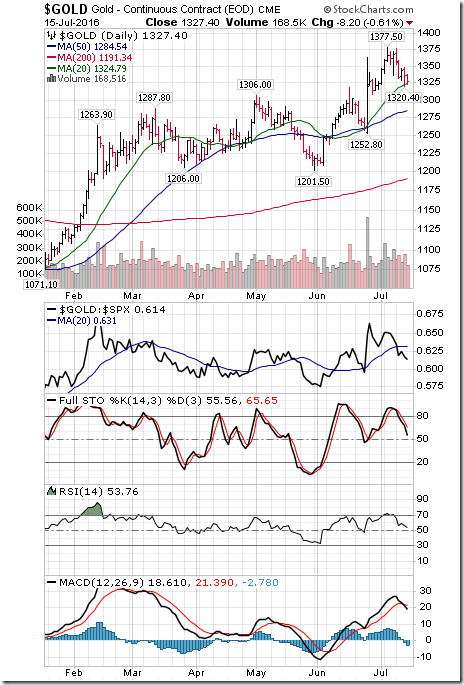
Gold dropped $31.00 per ounce (2.28%) last week. Intermediate trend remains up. Strength relative to the S&P 500 Index changed to neutral from positive. Gold remained above its 20 day moving average. Short term momentum indicators are trending down. Technical score dropped last week to 2 from 6.
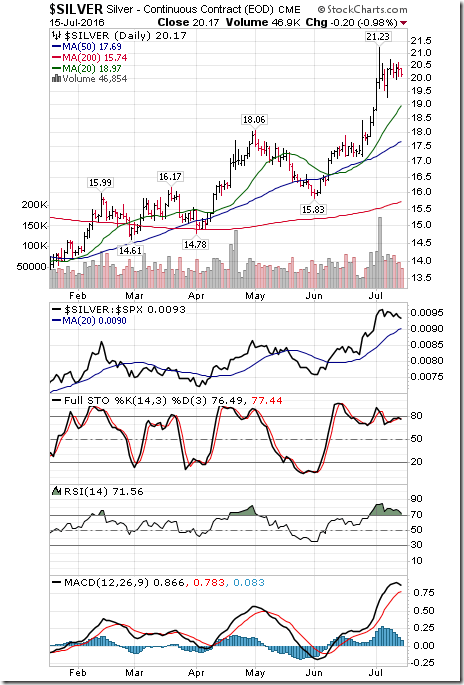
Silver added $0.07 per ounce (0.35%) last week. Intermediate trend remains up. Strength relative to the S&P 500 Index remains positive. Silver remains above its 20 day moving average. Short term momentum indicators have turned down. Technical score slipped last week to 4 from 6.
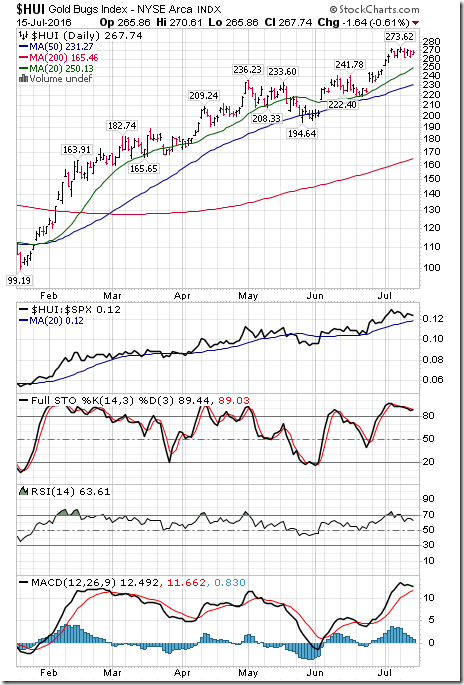
The AMEX Gold Bug Index slipped 3.79 points (1.40%) last week. Intermediate trend remains up. Strength relative to the S&P 500 Index remains positive. The Index remains above its 20 day moving average. Short term momentum indicators have just turned down. Technical score slipped last week to 4 from 6.
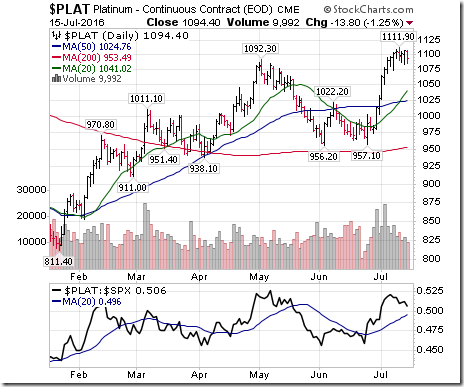
Platinum fell $5.80 per ounce (0.53%) last week. Intermediate trend remains up. Relative strength remains positive. PLAT remained above its 20 day MA. Momentum remains up.
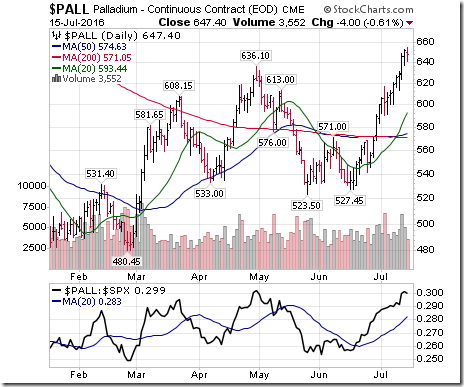
Palladium gained $30.30 per ounce (4.91%) last week. Intermediate trend changed to up from neutral. Strength relative to the S&P 500 Index remains positive. PALL remained above its 20 day moving average. Short term momentum indicators are trending up. Technical score: 6.
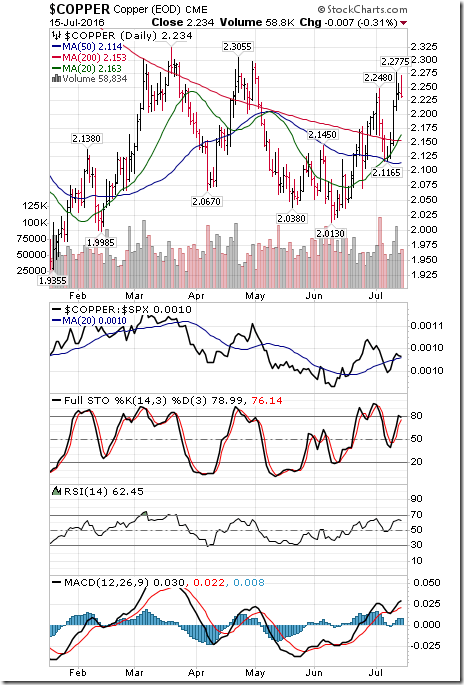
Copper added .115 cents per lb. (5.43%) last week. Intermediate trend remains neutral. Strength relative to the S&P 500 Index remained neutral. Copper remained above its 20 day moving average. Short term momentum indicators are trending up. Technical score improved last week to 2 from 0.
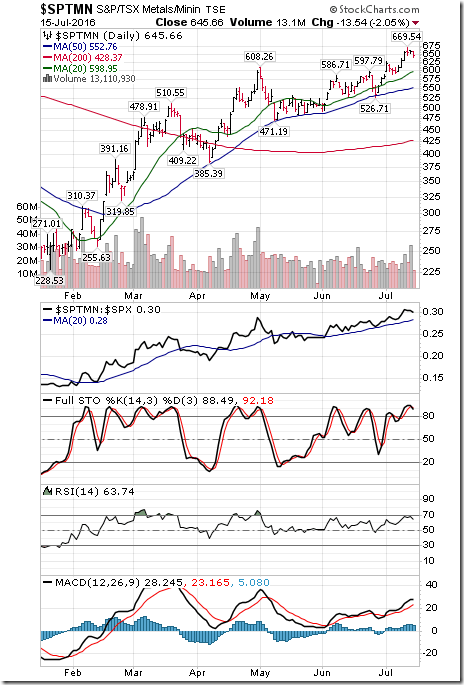
The TSX Metals and Mining Index gained another 36.62 points (6.01%) last week. Intermediate trend remains up. Strength relative to the S&P 500 Index remains positive. The Index remains above its 20 day moving average. Short term momentum indicators are trending up. Technical score remained at 6.
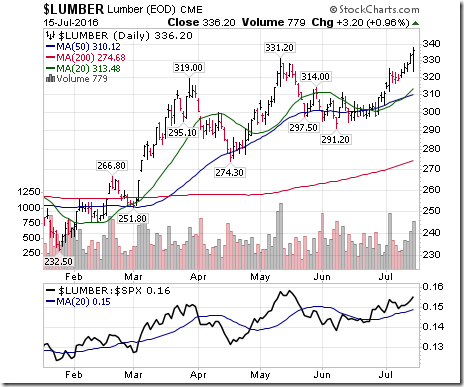
Lumber added $17.00 (5.33%) last week. Trend remains up. Relative strength remains positive. Lumber remains above its 20 day MA. Short term momentum remains up. Score: 6
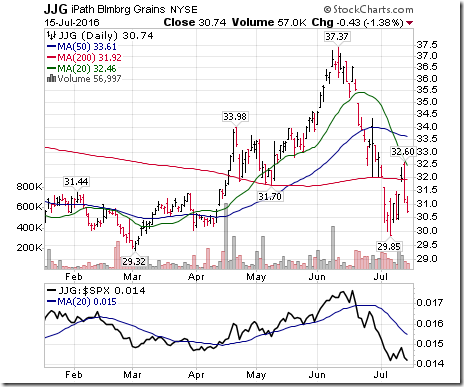
The Grain ETN added 0.72 (2.32%) last week. Strength relative to the S&P 500 Index remained negative. Units remained below their 20 day moving average. Short term momentum indicators are trending up. Technical score improved to -4 from -6.
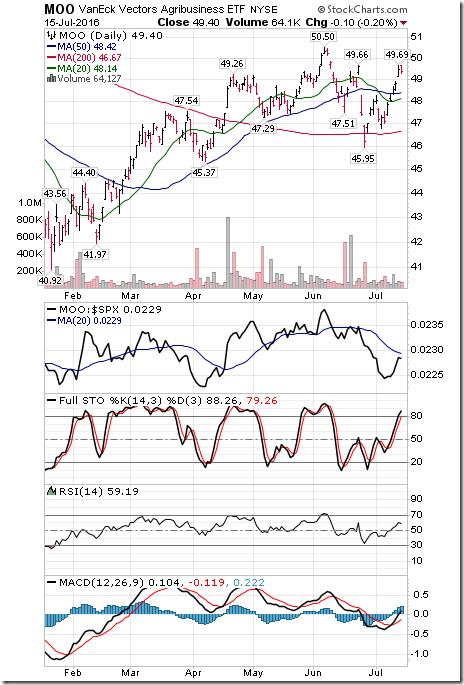
The Agriculture ETF added $1.51(3.15%) last week. Intermediate trend remains neutral. Strength relative to the S&P 500 Index remained negative. Units moved above its 20 day moving average. Short term momentum indicators are trending up. Technical score improved last week to 0 from -3.
Interest Rates
The yield on 10 year Treasuries jumped 22.8 basis points (16.69%) last week. Intermediate trend remains up. Yield moved above its 20 day moving average. Short term momentum indicators are trending up.
Conversely, price of the long term Treasury ETF plunged $5.21 (3.63%) last week. Intermediate trend remains up. Price fell below its 20 day moving average on Friday.
Volatility
The VIX Index dropped another 0.69 (5.22%) last week. Intermediate trend changed to down. The Index fell below its 20 day moving average.
Sectors
Daily Seasonal/Technical Sector Trends for March July 15th 2016
Green: Increase from previous day
Red: Decrease from previous day
StockTwits Released on Friday @EquityClock
The average peak to the summer rally period is now upon us.
Technical action by S&P 500 stocks to 10:00: Quietly bullish. Breakouts: $AMGN, $ANTM, $WRK, $HRB, CI. No stocks broke support.
Editor’s Note: After 10:00 AM EDT, one more S&P 500 stock broke resistance: Gilead.
WALL STREET RAW RADIO- JULY 16, 2016 WITH MARK LEIBOVIT
AND GUESTS SINCLAIR NOE, HENRY WEINGARTEN AND ERIC HADIK: http://tinyurl.com/h6e6ogw
Disclaimer: Seasonality and technical ratings offered in this report by www.timingthemarket.ca and www.equityclock.com are for information only. They should not be considered as advice to purchase or to sell mentioned securities. Data offered in this report is believed to be accurate, but is not guaranteed
Copyright © DV Tech Talk, Timingthemarket.ca


![clip_image002[5] clip_image002[5]](https://advisoranalyst.com/wp-content/uploads/2019/08/4ce73be858cff9a8c70ffe193f793224.png)
![clip_image002[7] clip_image002[7]](https://advisoranalyst.com/wp-content/uploads/2019/08/5f6faa788452609c2e0c4dc54bc1b911.png)
![clip_image002[9] clip_image002[9]](https://advisoranalyst.com/wp-content/uploads/2019/08/d55ce7a1be9f9b561c8b439e820a84d4.png)


