by Don Vialoux, Timingthemarket.ca
Interesting Charts
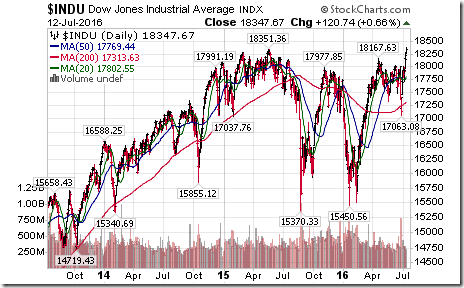
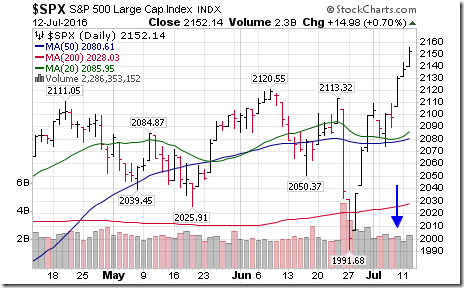
The Dow Jones Industrial Average broke above 18,351.36 to reach an all-time high. A word of caution! Breakouts by the Dow and S&P 500 Index have occurred on declining volume, an indication that investors are skeptical
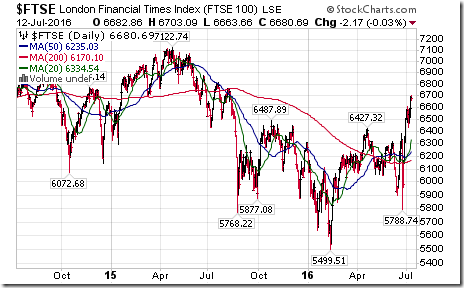
One of the triggers for the move was completion of a reverse head and shoulders pattern by the London FT Index
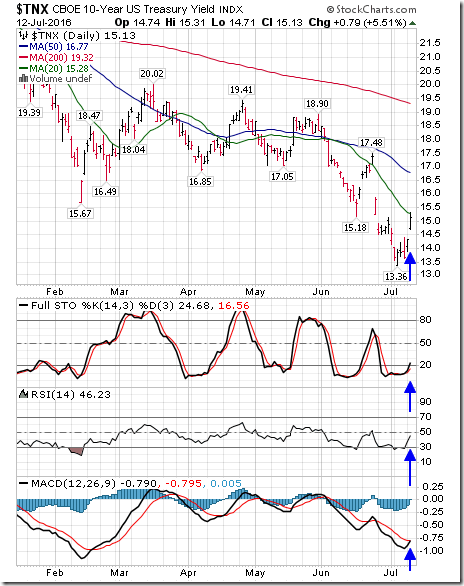
OOOPs!!! Treasury yields moved sharply higher and interest sensitive stocks and bonds came under pressure. Rotation, Rotation, Rotation?
StockTwits Released Yesterday
Stocks breakout as the Volatility Index tests support
Technical action by S&P 500 stocks to 10:15: Bullish. 19 S&P 500 stocks broke resistance.
Editor’s note: After 10:15 AM EDT, another 23 S&P 500 stocks broke resistance.
Technology stocks dominated the list of S&P 500 stocks breaking out: $ADI, $GLW, $HRS, $LLTC, $LRCX, $STX, $WDC, $YHOO.
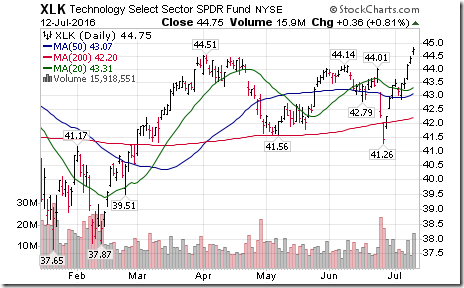
Strength in S&P Technology stocks triggered a break by $XLK above $44.51 to a 15 year high.
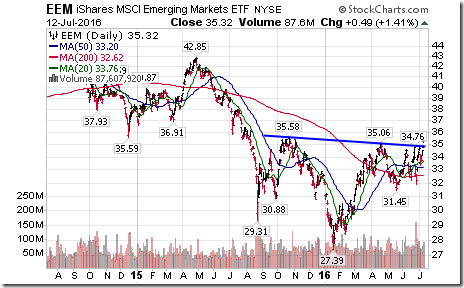
Nice breakout by Emerging Markets ETF $EEM above $35.06 completing a reverse head & shoulders pattern.
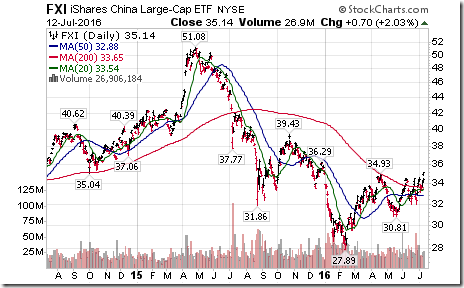
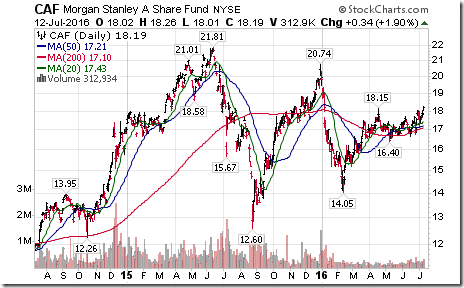
Nice breakout by China related ETFs and funds completing base building patterns: $CAF, $FXI
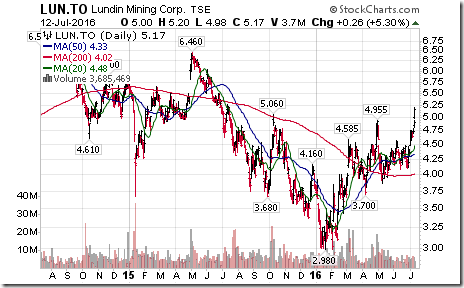
Strength in China equities is boosting base metal stocks. Nice reverse head & shoulders pattern by $LUN.CA!
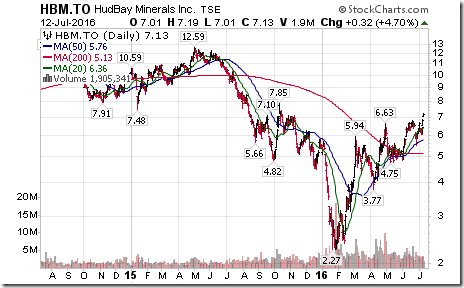
Editor’s Note: Hudbay Minerals completed a similar pattern
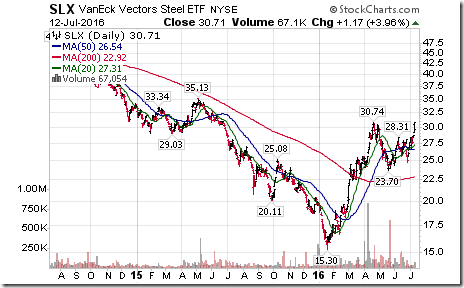
Strength in Chinese ETFs has prompted a break out aby the Steel ETF $SLX above $30.74 extending an intermediate uptrend.
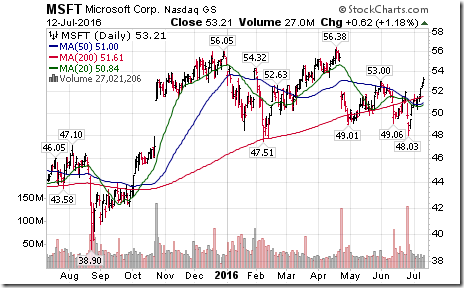
Nice breakout by $MSFT (a DJIA stock) above resistance at $53.00
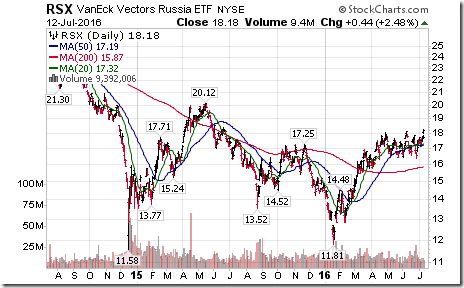
Strength in crude oil prices have prompted a break out by $RSX above $18.14 extending an intermediate uptrend.
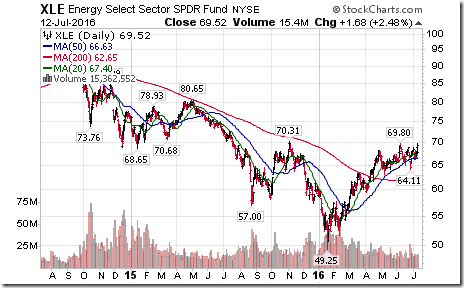
Higher crude oil prices have prompted a breakout by $XLE above $69.80 extending an intermediate uptrend.
Trader’s Corner
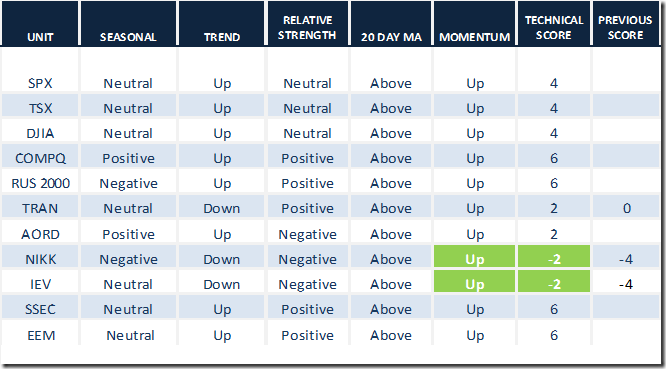
Daily Seasonal/Technical Equity Trends for July 12th 2016
Green: Increase from previous day
Red: Decrease from previous day
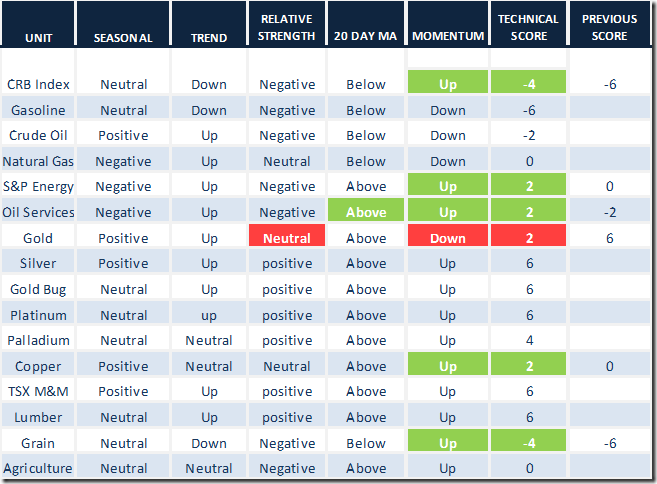
Daily Seasonal/Technical Commodities Trends for July 12th 2016
Green: Increase from previous day
Red: Decrease from previous day
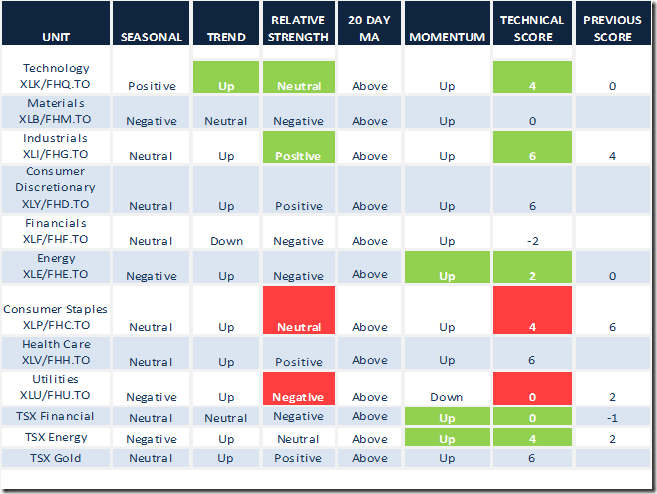
Daily Seasonal/Technical Sector Trends for March July 12th 2016
Green: Increase from previous day
Red: Decrease from previous day
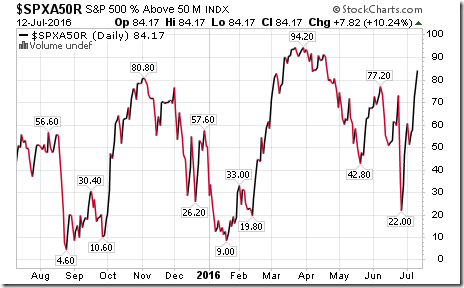
S&P 500 Momentum Barometer
The Barometer rose another 7.82 (10.24%) to 84.17. It remains intermediate overbought, but has yet to show signs of peaking.
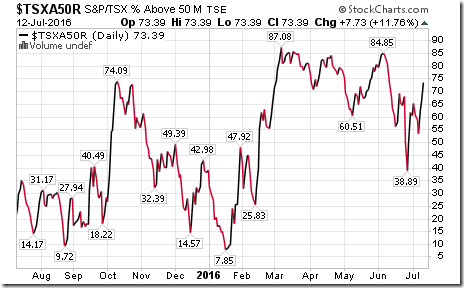
TSE Composite Momentum Barometer
The Barometer rose another 7.73 (11.76%) to 73.39%. It remains intermediate overbought, but has yet to show signs of peaking.
Special Free Services available through www.equityclock.com
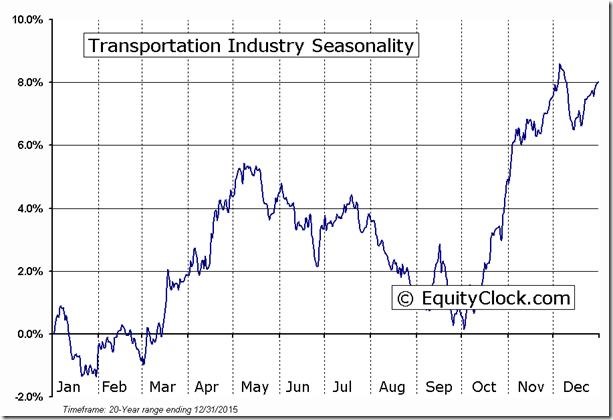
Equityclock.com is offering free access to a data base showing seasonal studies on individual stocks and sectors. The data base holds seasonality studies on over 1000 big and moderate cap securities and indices. To login, simply go to http://www.equityclock.com/charts. Following is an example:
Keith Richards’ Blog
Three things you should know about the market’s new highs
Following is a link:
http://www.valuetrend.ca/three-things-you-should-know-about-the-markets-new-highs/
Disclaimer: Seasonality and technical ratings offered in this report by www.timingthemarket.ca and www.equityclock.com are for information only. They should not be considered as advice to purchase or to sell mentioned securities. Data offered in this report is believed to be accurate, but is not guaranteed
Copyright © DV Tech Talk, Timingthemarket.ca


