by Don Vialoux, Timingthemarket.ca
Editor’s Note: Mr. Vialoux is scheduled to appear today at 1:00 PM EDT on BNN’s Market Call.
Economic News This Week
June Cdn. Housing Starts to be released at 8:15 AM EDT on Monday are expected to increase to 190,500 from 188,513 in May.
May Wholesale Inventories to be released at 10:00 AM EDT on Tuesday are expected to increase 0.2% versus no change in April.
Beige Book is scheduled to be released at 2:00 PM EDT on Wednesday
Weekly Initial Jobless Claims to be released at 8:30 AM EDT on Thursday are expected to increase to 265,000 from 254,000 last week.
June Producer Prices to be released at 8:30 AM EDT on Thursday are expected to increase 0.3 versus a gain of 0.4% in May. Excluding food and energy, June Producer Prices are expected to increase 0.1% versus a gain of 0.3% in May.
July Empire State Manufacturing Index to be released at 8:30 AM EDT on Friday is expected to slip to 5.0 from 6.0 in June.
June Retail Sales to be released at 8:30 AM EDT on Friday are expected to increase 0.2% versus a gain of 0.5% in May. Excluding auto sales, June Retail Sales are expected to increase 0.4% versus a gain of 0.4% in May.
June Consumer Prices to be released at 8:30 AM EDT on Friday are expected to increase 0.3% versus a gain of 0.2% in May. Excluding food and energy, June Consumer Prices are expected to increase 0.2% versus a gain of 0.2% in May.
May Business Inventories to be released at 10:00 AM EDT on Friday are expected to increase 0.2% versus a gain of 0.1% in April.
July Michigan Sentiment Index to be released at 10:00 AM EDT on Friday is expected to slip to 93.0 from 94.3 in June.
Earnings News This Week
Wednesday: CSX, Kinder Morgan, Yum Brands
Thursday: Blackrock, Delta Air, JP Morgan, Omnicom
Friday: Citigroup, PNC Financial, US Bancorp, Wells Fargo
The Bottom Line
U.S. equity markets once again are testing all-time highs thanks to an encouraging employment report released on Friday. Institutional traders may try to trigger technical buying by pushing the S&P 500 Index and Dow Jones Industrial Average to all-time highs. However, short term strength is likely to be short lived. Weak second quarter reports starting this week that frequently include lower guidance for third quarter results will not help. Caution in equity markets is preferred.
Observations
Investor and consumer confidence in the U.S. took a hit over the weekend when race inspired riots broke out in major cities across the country. Looks like another long hot summer. Disturbances this year are happening just before the Republic and Democrat conventions later this month, events that historically have been targets for unrest.
Economic focuses this week are on June Producer Prices on Thursday and June Retail Sales and June Consumer Prices on Friday.
Response to the better than consensus June employment report released on Friday was encouraging. Several S&P sectors broke to new highs on Friday including Industrials, Consumer Discretionary and Health Care. However, significant follow through by U.S. equity indices this week given overbought short and intermediate technical conditions and overhead resistance.
Second quarter earnings reports start to appear later this week. Focus is on reports from Financial services companies to be released on Thursday and Friday. Twenty six S&P 500 companies and one Dow Jones Industrial Average company are scheduled to release results this week. Consensus calls for a 5.6% year-over-year decline in earnings by S&P 500 companies as well as a 0.7% decline in revenues. To date, 81 S&P 500 companies have issued negative second quarter guidance while 32 companies have issued positive guidance. Watch for negative third quarter guidance by large international companies with U.K. operations that will be hit by the sharp drop in the British Pound triggered by Brexit. Second quarter earnings by Dow Jones Industrial companies are expected to be better than earnings by S&P 500 companies: up 2.1% on a year-over-year basis. Ditto for Canada’s top 60 companies! Consensus calls for an average (median) gain for earnings per share of 0.68%
Earnings and revenue projections for S&P 500 companies in the second half of 2016 remain mildly encouraging. According to FactSet, year-over-year earnings are expected to increase 0.7% in the third quarter and 7.1% in the fourth quarter.
Seasonal influences for North American equity markets are slightly positive this week, followed by start of a neutral/ negative period lasting until the second week in October.
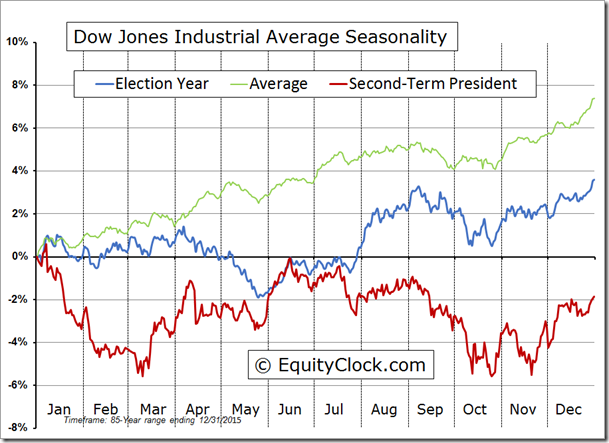
Historically, the Dow Jones Industrial Average during the year, when a new U.S. President is elected after two terms, has a difficult time starting in mid-July and lasting until mid-October
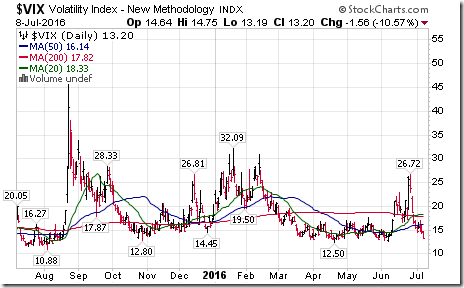
The VIX Index is a key indicator to watch from its low in early July to its high in mid-October. Maintenance of a low VIX Index below 20% implies stable equity indices. However, an unexpected international/political event that spikes the Index above the 20% level in the summer indicates start of an intermediate correction. An event has happened during each of the past nine summers. Caveat emptor!
Equity Indices and related ETFs
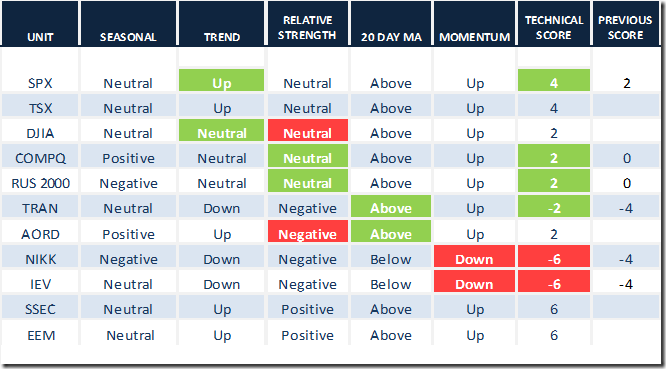
Daily Seasonal/Technical Equity Trends for July 8th 2016
Green: Increase from previous day
Red: Decrease from previous day
Calculating Technical Scores
Technical scores are calculated as follows:
Intermediate Uptrend based on at least 20 trading days: Score 2
Higher highs and higher lows
Intermediate Neutral trend: Score 0
Not up or down
Intermediate Downtrend: Score -2
Lower highs and lower lows
Outperformance relative to the S&P 500 Index: Score: 2
Neutral Performance relative to the S&P 500 Index: 0
Underperformance relative to the S&P 500 Index: Score –2
Above 20 day moving average: Score 1
At 20 day moving average: Score: 0
Below 20 day moving average: –1
Up trending momentum indicators (Daily Stochastics, RSI and MACD): 1
Mixed momentum indicators: 0
Down trending momentum indicators: –1
Technical scores range from -6 to +6. Technical buy signals based on the above guidelines start when a security advances to at least 0.0, but preferably 2.0 or higher. Technical sell/short signals start when a security descends to 0, but preferably -2.0 or lower.
Long positions require maintaining a technical score of -2.0 or higher. Conversely, a short position requires maintaining a technical score of +2.0 or lower.
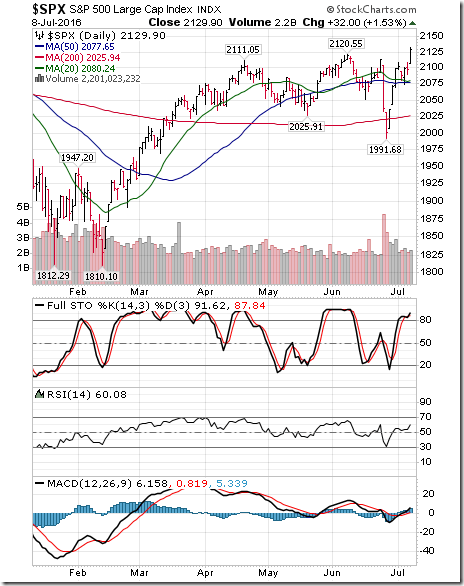
The S&P 500 Index gained 26.95 points (1.28%) last week. Intermediate uptrend was re-affirmed on Friday when the Index moved above 2,120.55. The Index tested its all-time inter-day high at 2,134.72. The Index remained above its 20 day moving average. Short term momentum indicators are trending up and are overbought but have yet to show signs of peaking.
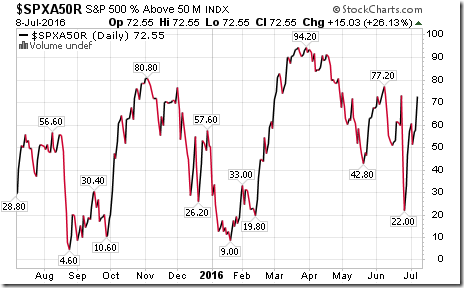
Percent of S&P 500 stocks trading above their 50 day moving average (Also known as the S&P 500 Momentum Barometer) advanced last week to 72.55% from 60.92%. Percent remained at an intermediate overbought level.
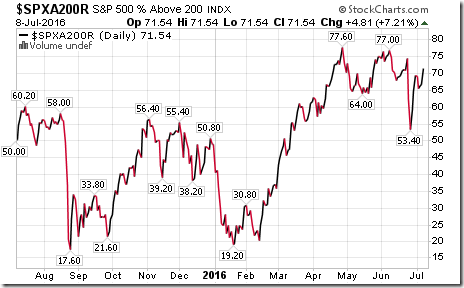
Percent of S&P 500 stocks trading above their 200 day moving average increased last week to 71.54% from 69.14%. Percent remained at an intermediate overbought level.
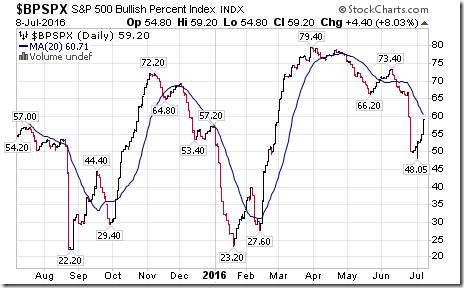
Bullish Percent Index for S&P 500 stocks increased last week to 59.20% from 52.80%, but remained below its 20 day moving average. The Index remains intermediate overbought.
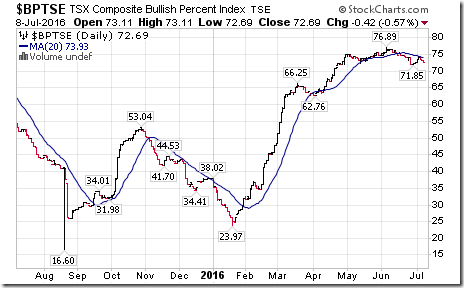
Bullish Percent Index for TSX Composite stocks was unchanged last week at 72.69% and remained below its 20 day moving average. Percent remains intermediate overbought and trending down.
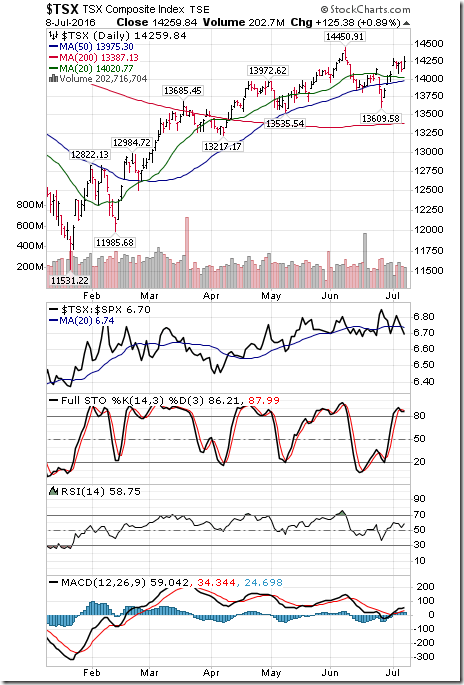
The TSX Composite Index added 195.30 points (1.39%) last week. Intermediate trend remains up (Score: 2). Strength relative to the S&P 500 Index remained neutral (Score: 0). The Index remained above its 20 day moving average (Score: 1). Short term momentum indicators are trending up (Score: 1), but are overbought. Technical score remained last week at 4.
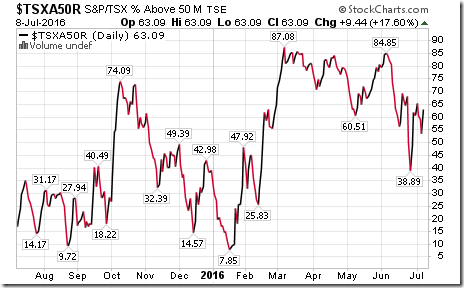
Percent of TSX stocks trading above their 50 day moving average (Also known as the TSX Composite Momentum Barometer) increased last week to 63.09% from 60.51%. Percent remains intermediate overbought.
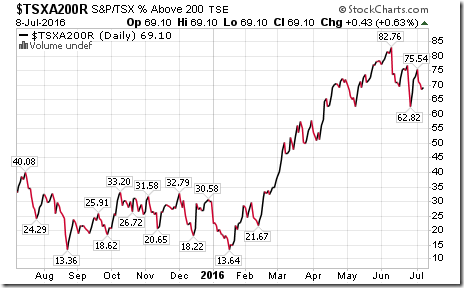
Percent of TSX stocks trading above their 200 day moving average slipped last week to 69.10% from 72.96%. Percent remains intermediate overbought and trending down.
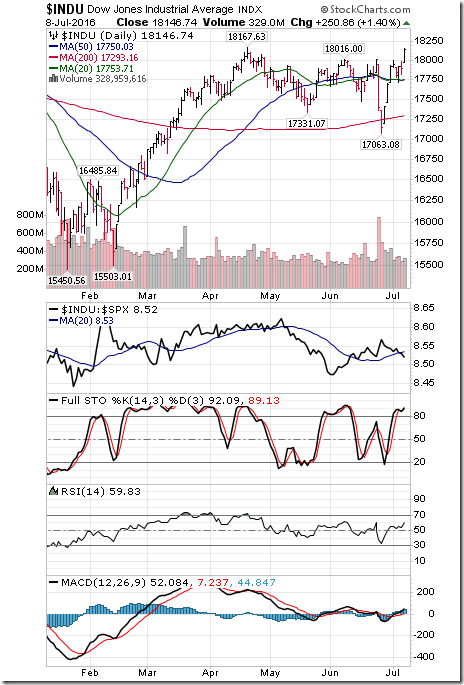
The Dow Jones Industrial Average gained 199.37 points (1.10%) last week. Intermediate trend changed on Friday to neutral from down on a move above 18,016.00. Strength relative to the S&P 500 Index changed to neutral from positive. The Average remained above its 20 day moving average. Short term momentum indicators are trending up and are overbought, but have yet to show signs of peaking. Technical score last week remained at 2.
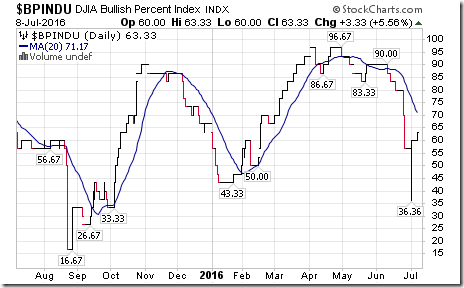
Bullish Percent Index for Dow Jones Industrial Average stocks increased last week to 63.33% from 60.00%, but remained below its 20 day moving average. The Index remains intermediate overbought.
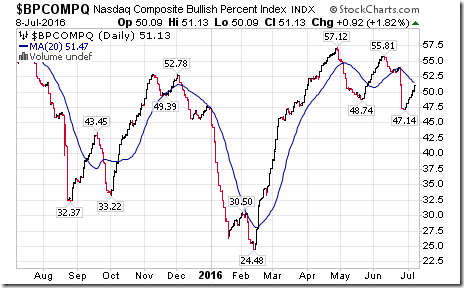
Bullish Percent Index for NASDAQ Composite stocks increased last week to 51.13% from 48.84%, but remained below its 20 day moving average. The Index has returned to an intermediate overbought level.
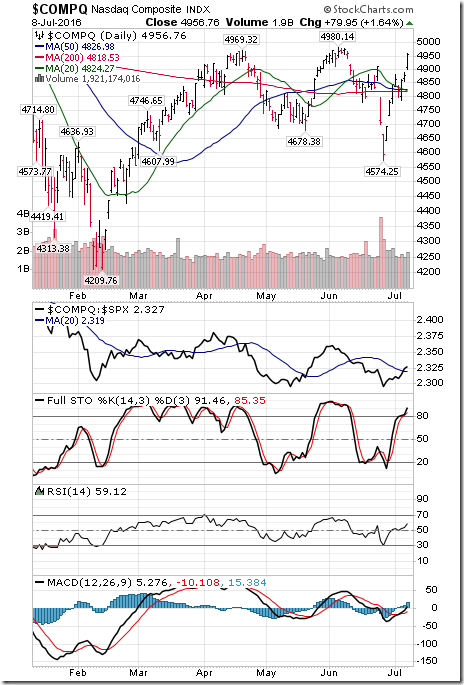
The NASDAQ Composite Index gained 94.19 points (1.94%) last week. Intermediate trend remains neutral. Strength relative to the S&P 500 Index improved to neutral from negative. The Index remained above its 20 day moving average. Short term momentum indicators are trending up and are overbought, but have yet to show signs of peaking.
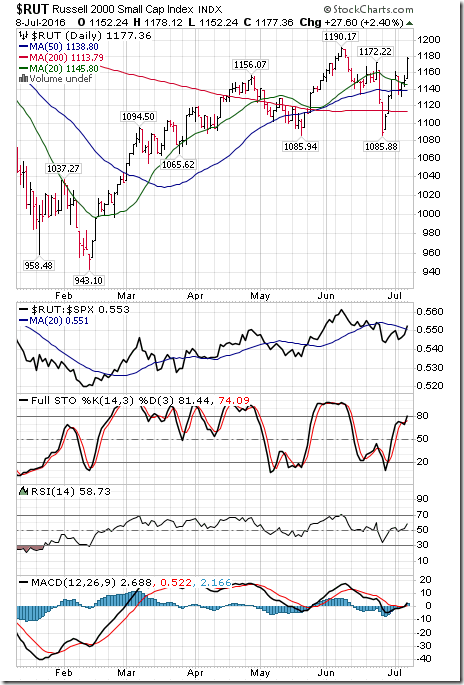
The Russell 2000 Index added 20.59 points (1.78%) last week. Intermediate trend remains neutral. Strength relative to the S&P 500 Index changed to neutral from negative on Friday. The Index remains above its 20 day moving average. Short term momentum indicators are trending up and are overbought, but have yet to show signs of peaking. Technical score improved last week to 2 from 0
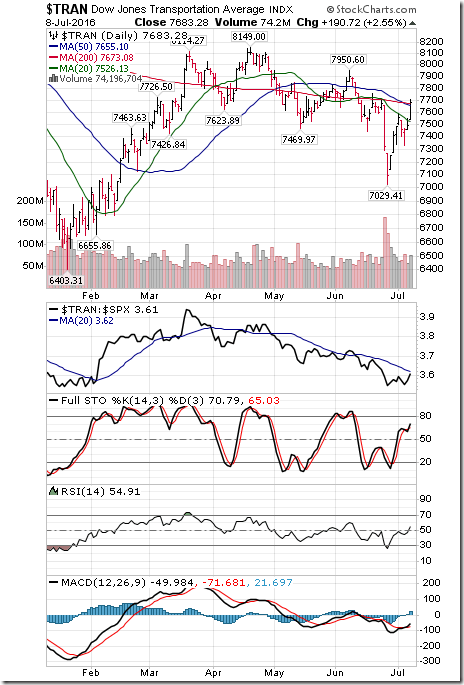
The Dow Jones Transportation Average gained 125.66 points (1.66%) last week. Intermediate trend remains down. Strength relative to the S&P 500 Index remains negative. The Average moved above its 20 day moving average on Friday. Short term momentum indicators are trending up. Technical score improved last week to -2 from -4.
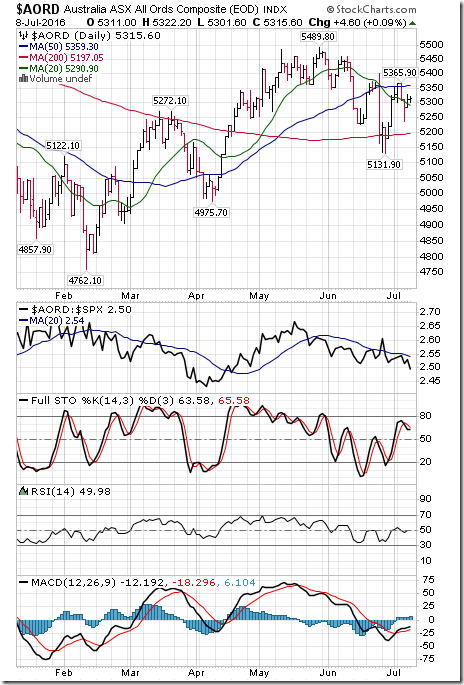
The Australia All Ordinaries Composite Index slipped 11.40 points (0.21%) last week. Intermediate trend remains up. Strength relative to the S&P 500 Index changed to negative from neutral. The Index moved above its 20 day moving average. Short term momentum indicators are trending up. Technical score remained last week at 2.
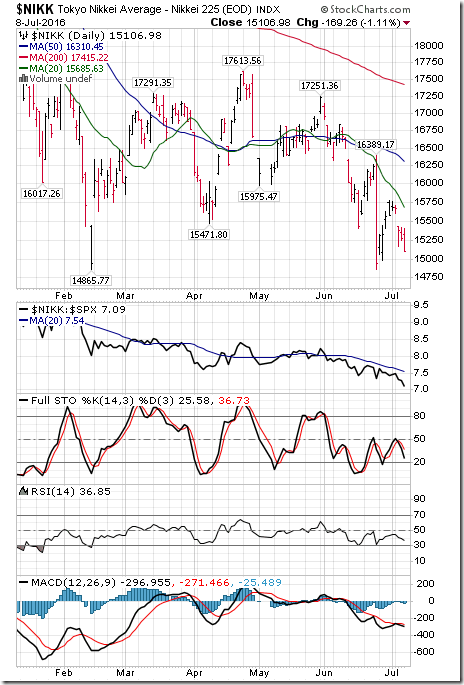
The Nikkei Average lost 575.50 points (3.67%) last week. Intermediate trend remains down. Strength relative to the S&P 500 Index remains negative. Short term momentum indicators are trending down. Technical score slipped last week to -6 from -4.
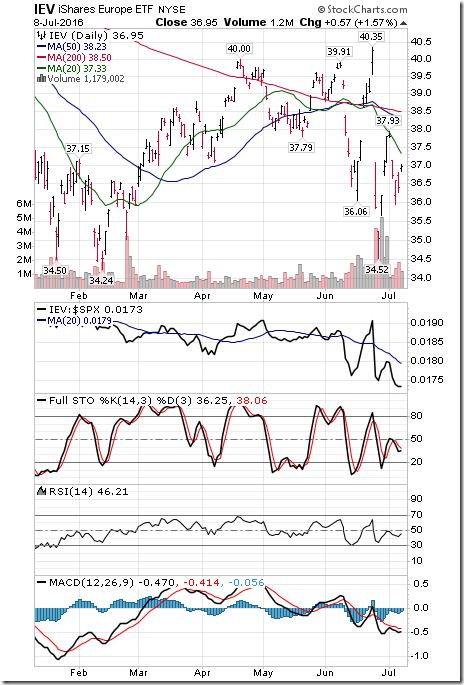
Europe iShares dropped $0.84 (2.22%) last week. Intermediate trend remains down. Strength relative to the S&P 500 Index remains negative. Units remain below their 20 day moving average. Short term momentum indicators are trending down. Technical score slipped last week to -6 from -4.
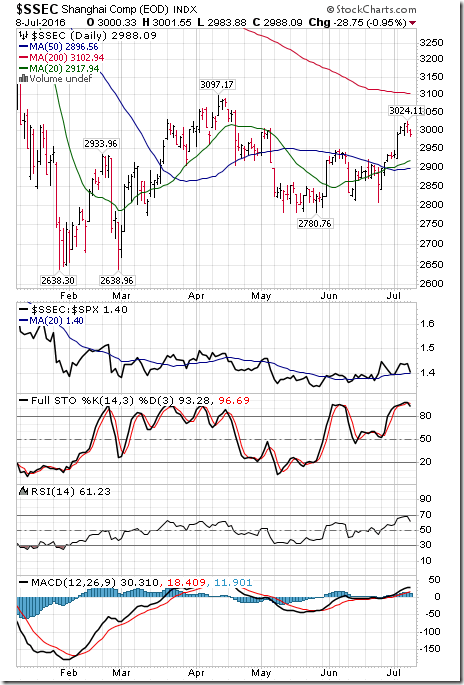
The Shanghai Composite Index added 55.61 points (1.90%) last week. Intermediate trend remains up. Strength relative to the S&P 500 Index remains positive. The Index remains above its 20 day moving average. Short term momentum indicators are trending up and are overbought, but have yet to show signs of peaking. Technical score remained at 6.
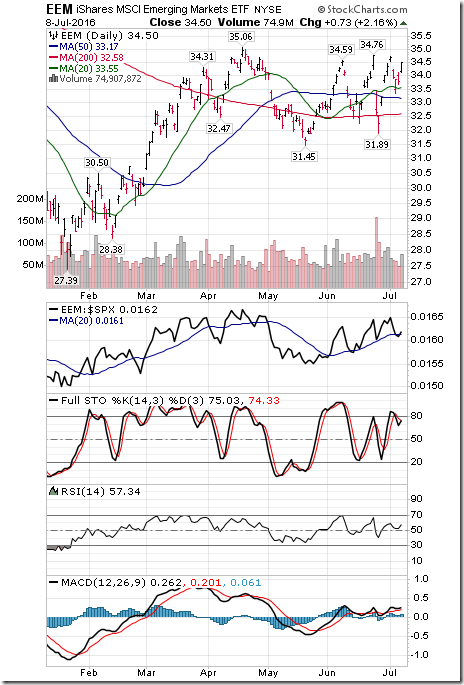
Emerging markets iShares slipped $0.19 (0.55%) last week. Intermediate trend remains up. Strength relative to the S&P 500 remains positive. Units remain above their 20 day moving average. Short term momentum indicators are trending up and are overbought, but have yet to show signs of peaking.
Currencies
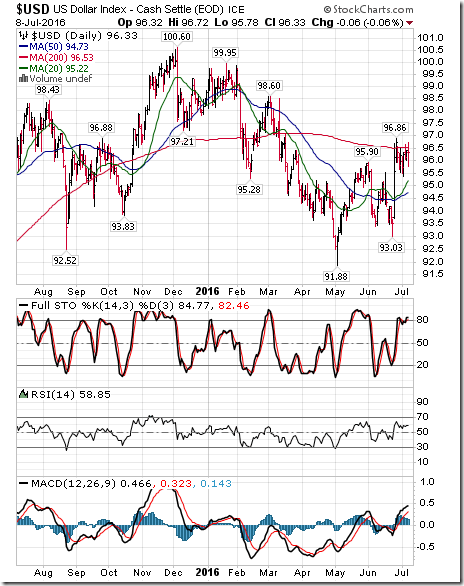
The U.S. Dollar Index gained 0.57 (0.60%) last week. Intermediate trend remains up. The Index remains above its 20 day moving average. Short term momentum indicators are trending up and are overbought, but have yet to show signs of peaking.
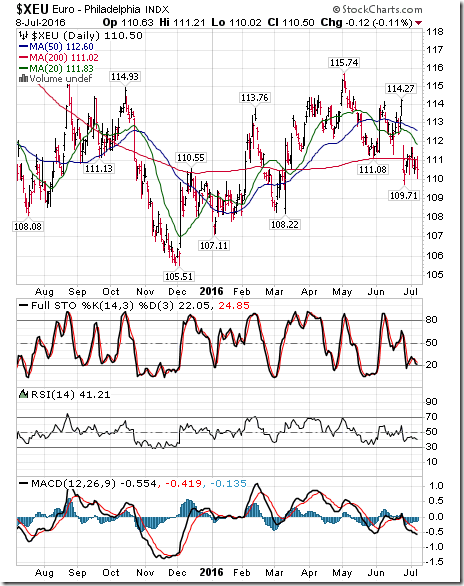
The Euro dropped 0.84 (0.75%) last week. Intermediate trend remains down. The Euro remains below its 20 day moving average. Short term momentum indicators are trending down.
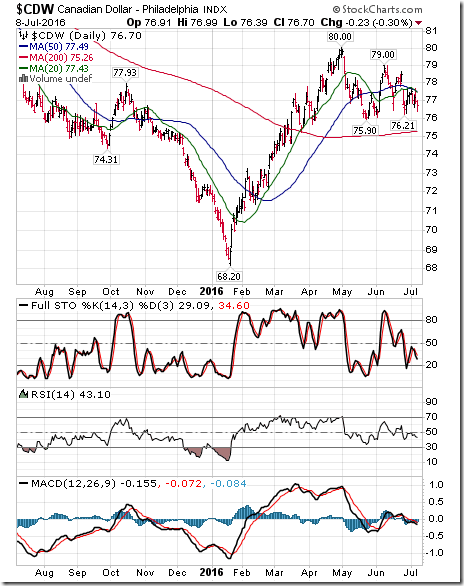
The Canadian Dollar slipped US0.81 cents (1.05%) last week. Intermediate trend remains up. The Canuck Buck dropped below its 20 day moving average. Short term momentum indicators are trending down.
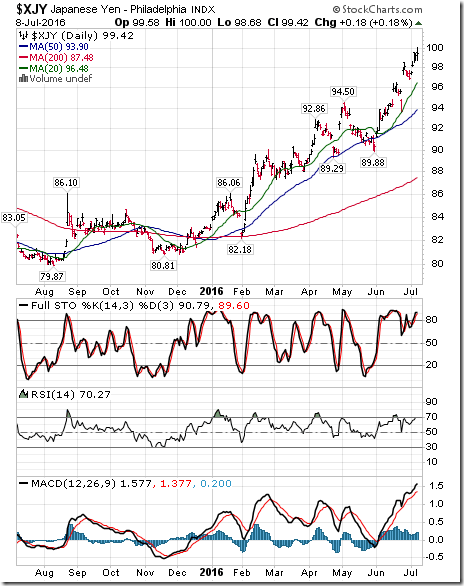
The Japanese Yen jumped 2.00 (2.05%) last week. Intermediate trend remains up. The Yen remains above its 20 day moving average. Short term momentum indicators are trending up and are overbought.
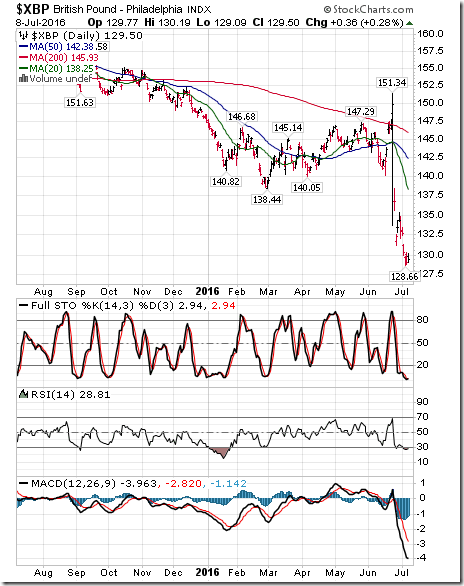
The British Pound plunged 4.15 (2.37%) last week. Intermediate trend is down. The Pound remains below its 20 day moving average. Short term momentum indicators are trending down and are oversold.
Commodities
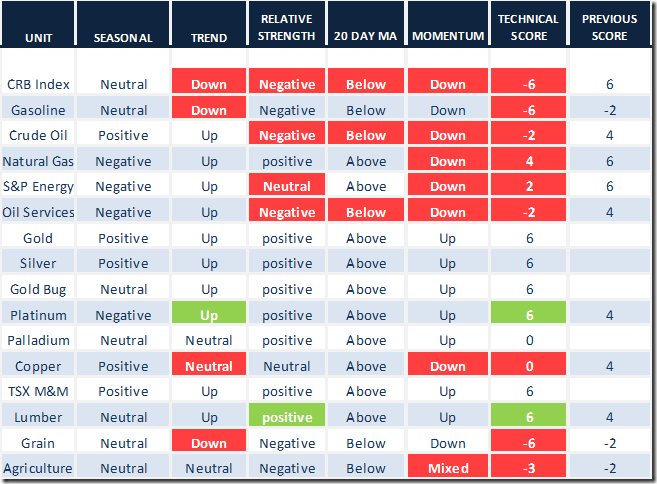
Daily Seasonal/Technical Commodities Trends for July 8th 2016
Green: Increase from previous day
Red: Decrease from previous day
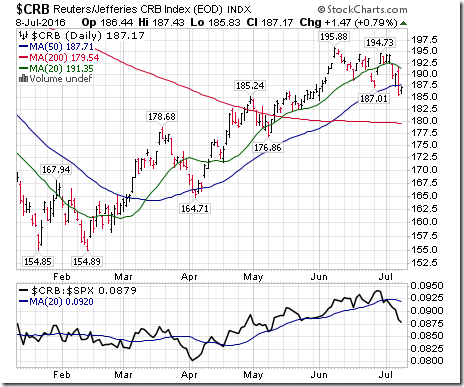
The CRB Index dropped 7.09 points (3.65%) last week. Trend changed last week to down from up. Strength relative to the S&P 500 Index changed to negative from positive. The Index dropped below its 20 day moving average. Short term momentum indicators are trending down. Technical score dropped last week to -6 from +6.
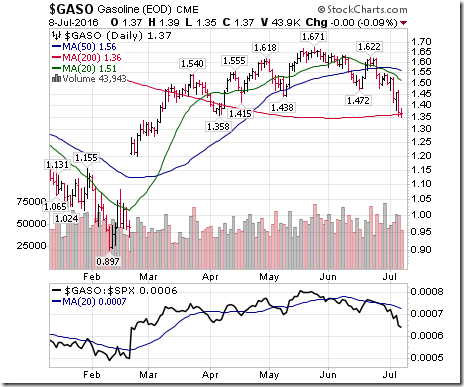
Gasoline plunged $0.15 per gallon (9.87%) last week. Trend changed to down from up on a move below $1.472. Strength relative to the S&P 500 Index remains negative. Gas remained below its 20 day moving average. Short term momentum indicators are trending down. Technical score dropped to -6 from -2.
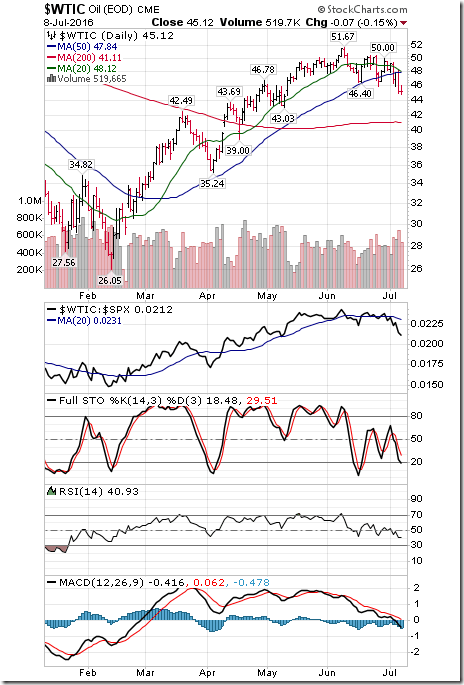
Crude Oil dropped $3.87 per barrel (7.85%) last week. Intermediate trend remains up. Strength relative to the S&P 500 Index changed to negative from neutral. Crude fell below its 20 day moving average. Short term momentum indicators are trending down. Technical score dropped last week to -2 from 4.
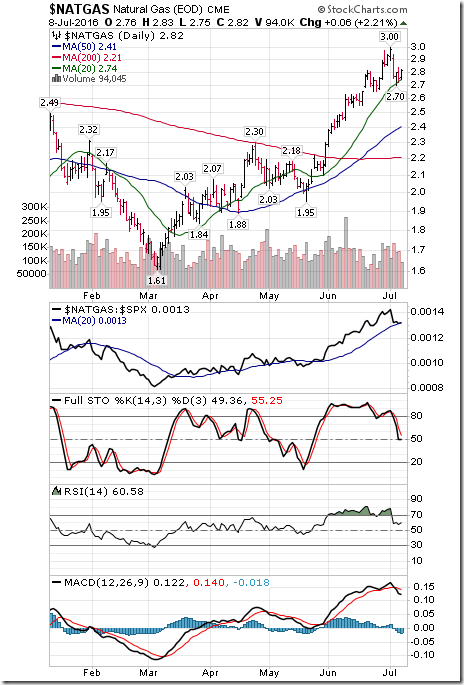
Natural Gas dropped $0.19 per MBtu (6.35%) last week. Intermediate trend remains up. Strength relative to the S&P 500 Index remains positive. “Natty” remains above its 20 day moving average. Short term momentum indicators are trending down. Technical score slipped last week to 4 from 6.
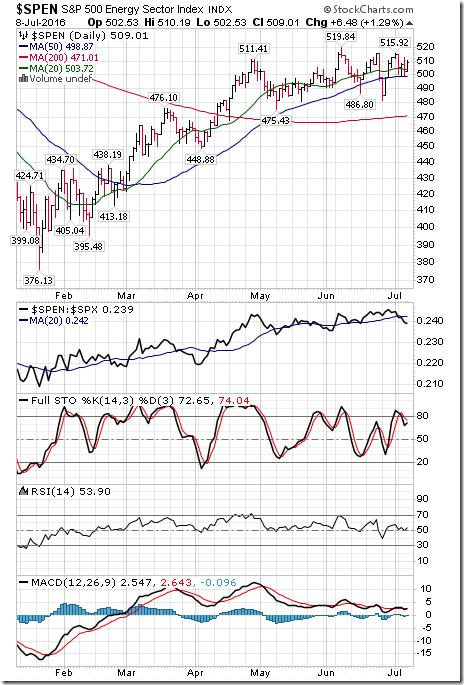
The S&P Energy Index slipped 5.78 points (1.12%) last week. Intermediate trend remains up. Strength relative to the S&P 500 Index changed to neutral from positive. The Index remains above its 20 day moving average. Short term momentum indicators have rolled over. Technical score dropped last week to 6 to 2.
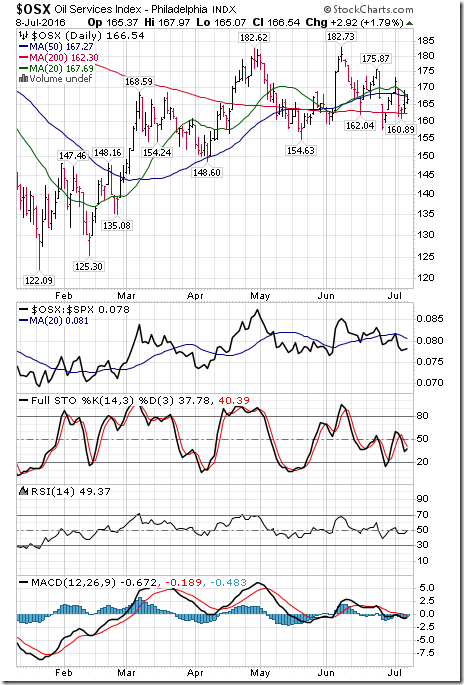
The Philadelphia Oil Services Index dropped 5.48 points (3.19%) last week. Intermediate trend remains up. Strength relative to the S&P 500 Index changed to negative from neutral. The Index dropped below its 20 day moving average. Short term momentum indicators have rolled over. Technical score dropped last week to -2 from 4.
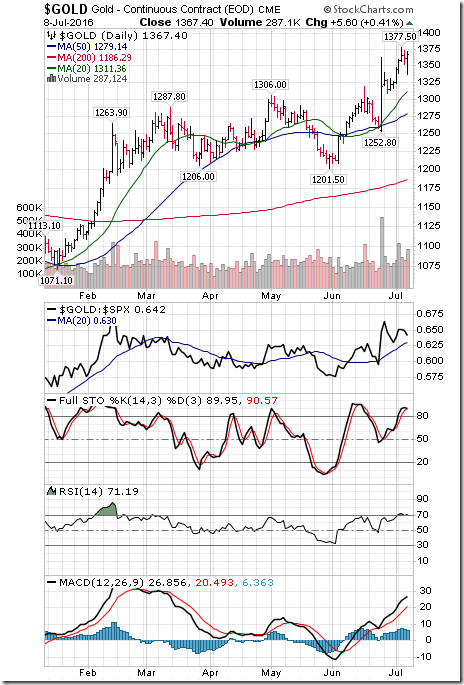
Gold added $13.50 per ounce (1.00%) last week. Intermediate trend remains up. Strength relative to the S&P 500 Index remains positive. Gold remains above its 20 day moving average. Short term momentum indicators are trending up. Technical score remained last week at 6.
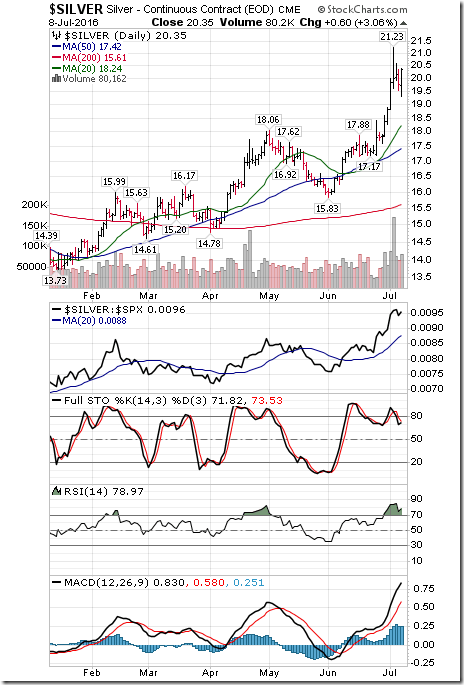
Silver added $0.15 per ounce (0.76%) last week. Intermediate trend remains up. Strength relative to the S&P 500 Index remains positive. Silver remains above its 20 day moving average. Short term momentum indicators are trending up. Technical score remains at 6.
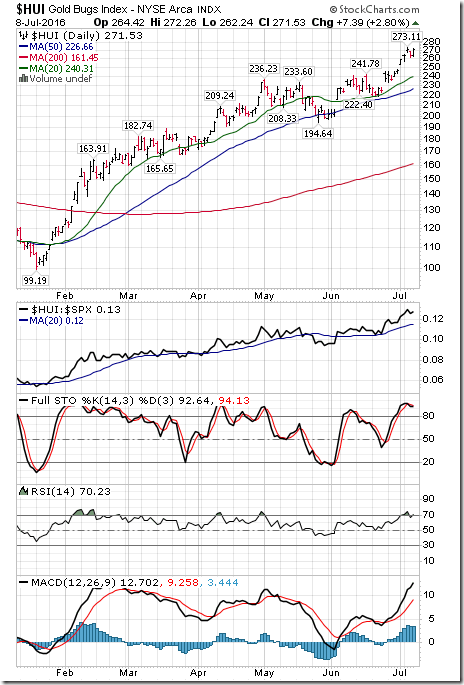
The AMEX Gold Bug Index added another 12.55 points (4.85%) last week. Intermediate trend remains up. Strength relative to the S&P 500 Index remains positive. The Index remains above its 20 day moving average. Short term momentum indicators are trending up and are overbought. Technical score remains at 6.
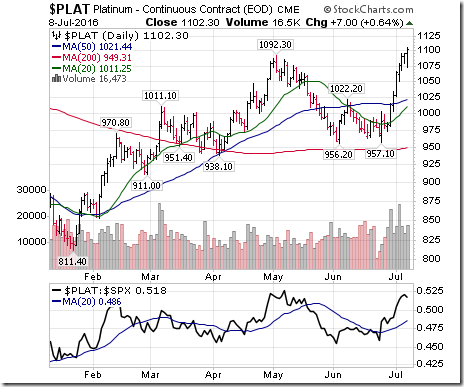
Platinum gained $36.20 per ounce (3.40%) last week. Intermediate trend changed to up. Relative strength remains positive. PLAT remains above its 20 day MA. Momentum remains up.
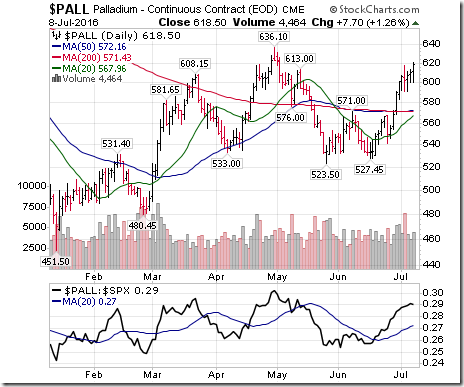
Palladium gained $11.35 per ounce (1.87%) last week. Intermediate trend remains neutral. Strength relative to the S&P 500 Index remains positive. PALL remains above its 20 day moving average. Short term momentum indicators are trending up. Technical score remained at 4
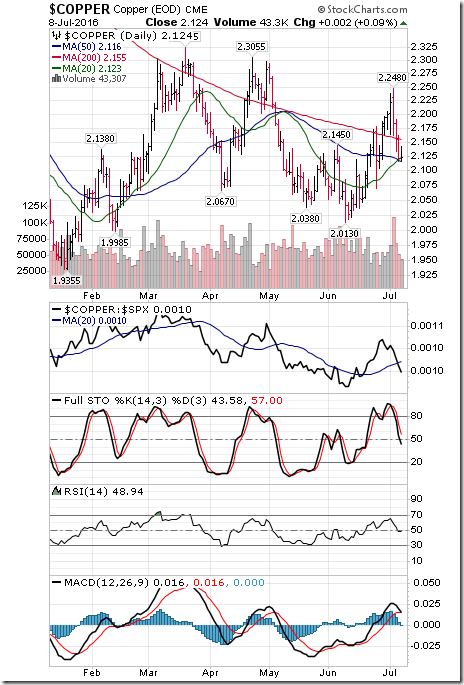
Copper dropped 10.2 cents per lb (4.60%) last week. Intermediate trend remains neutral. Strength relative to the S&P 500 Index changed to neutral from positive. Copper remains above its 20 day moving average. Short term momentum indicators are trending down. Technical score dropped last week to 0 from 4
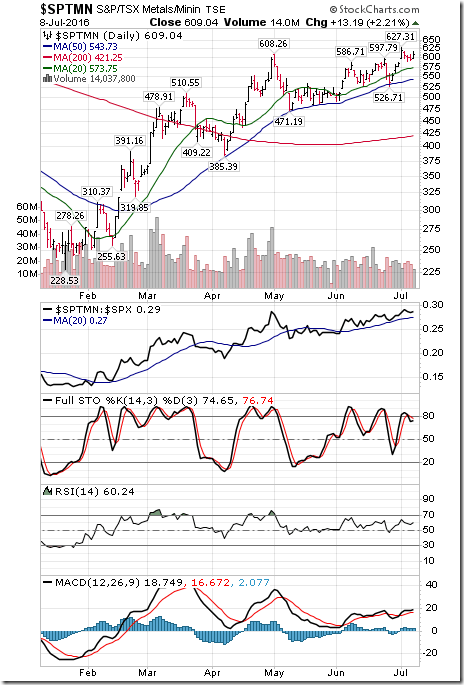
The TSX Metals & Mining Index added 24.68 points (4.22%) last week. Intermediate trend remains up. Strength relative to the S&P 500 Index remains positive. The Index remains above its 20 day moving average. Short term momentum indicators are trending up. Technical score remained at 6.
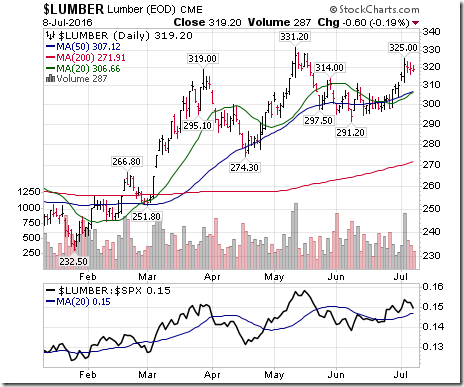
Lumber added 4.30 (1.37%) last week. Trend remains up. Relative strength improved to positive. Lumber remains above its 20 day MA. Short term momentum indicators are trending up
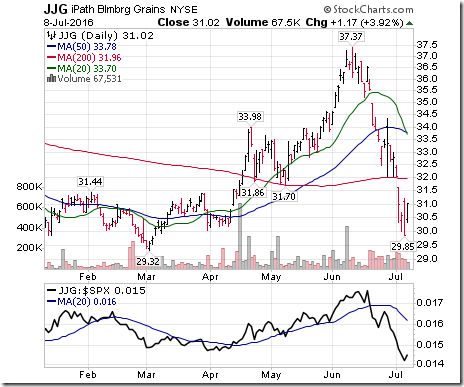
The Grain ETN dropped another $1.03 (3.21%) last week. Trend changed to down on a break below $31.70. Strength relative to the S&P 500 Index remains negative. Units remained below their 20 day MA. Short term momentum indicators are trending down. Score:-6
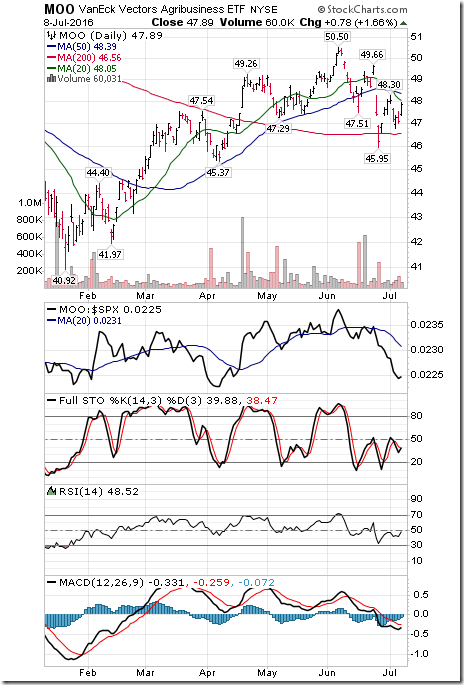
The Agriculture ETF slipped $0.15 (0.31%) last week. Intermediate trend remains at neutral. Strength relative to the S&P 500 Index remained negative. Units remained below their 20 day moving average. Short term momentum indicators are mixed. Technical score slipped last week to -3 from -2.
Interest Rates
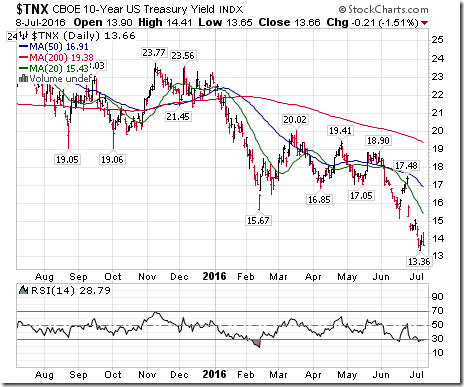
The yield on 10 year Treasuries dropped another 9 basis points (6.18%) last week. Intermediate trend remains down. Yield remains below its 20 day moving average. Short term momentum indicators are trending down and are oversold.
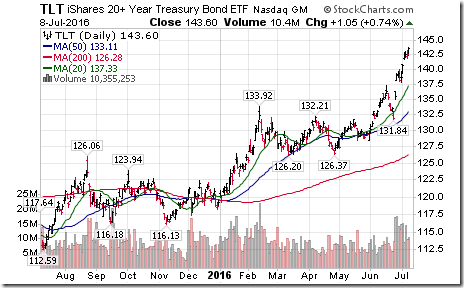
Conversely, price of the long term Treasury ETF gained another $3.03 (2.16%) last week. Units remain above their 20 day moving average.
Volatility
The VIX Index plunged 1.54 (10.43%) last week. Intermediate trend remains up. However, the Index remained below its 20, 50 and 200 day moving averages.
Sectors
Daily Seasonal/Technical Sector Trends for March July 8th 2016
Green: Increase from previous day
Red: Decrease from previous day
WALL STREET RAW RADIO WITH MARK LEIBOVIT
AND GUEST SINCLAIR NOE, HENRY WEINGARTEN AND CHRIS KIMBLE – JULY 9,2016
Disclaimer: Seasonality and technical ratings offered in this report by www.timingthemarket.ca and www.equityclock.com are for information only. They should not be considered as advice to purchase or to sell mentioned securities. Data offered in this report is believed to be accurate, but is not guaranteed
Copyright © DV Tech Talk, Timingthemarket.ca


![clip_image002[5] clip_image002[5]](https://advisoranalyst.com/wp-content/uploads/2019/08/75ec045629a64ed34bda8938540f62fb.png)


