by Don Vialoux, Timingthemarket.ca
Our next Tech Talk will be available on Monday, July 11th. See you then!
Economic News This Week
May Factory Orders to be released at 10:00 AM EDT on Tuesday are expected to drop 0.9% versus a gain of 1.9% in April
May U.S. Trade Deficit to be released at 8:30 AM EDT on Wednesday is expected to increase to $40.0 billion from $37.4 billion in April
June ISM Services to be released at 10:00 AM EDT on Wednesday are expected to increase to 53.3 from 52.9 in May.
FOMC Meeting Minutes for the June 15th meeting are released at 2:00 PM EDT on Wednesday
Canadian May Merchandise Trade Deficit to be released at 8:30 AM EDT on Wednesday is expected to increase to $3.0 billion from $2.7 billion in April.
June ADP Employment to be released at 8:15 AM EDT on Thursday is expected to slip to 152,000 from 173,000 in May.
June Non-farm Payrolls to be released at 8:30 AM EDT on Friday are expected to increase to 175,000 from 38,000 in May. Private Non-farm Payrolls are expected to increase to 170,000 from 25,000 in May. June Unemployment Rate is expected to increase to 4.8% from 4.7% in May. June Hourly Earnings are expected to increase 0.2% versus a gain of 0.2% in May.
Canadian June Employment is expected to increase 9,000 versus a gain of 13,800 in May. June Unemployment Rate is expected to increase to 7.0% from 6.9% in May.
Earnings Reports This Week
Wednesday: Walgreen Boots
Thursday: Pepsico
The Bottom Line
Strength has returned equity indices and related market ETFs to intermediate overbought levels and to formidable intermediate overhead resistance levels. Anticipation of mixed calendar second quarter reports on both sides of the border will not help. Caution in equity markets is preferred. Some sector exceptions exist (Not for the faint of heart): base metals, biotech.
Observations
Economic focuses this week are on FOMC meeting minutes to be released on Wednesday and the June U.S. Employment report on Friday.
Earnings reports to be released this week are not expected to be an influencing factor on equity markets. Most major U.S. and Canadian companies are in a “quiet period” prior to release of second quarter results.
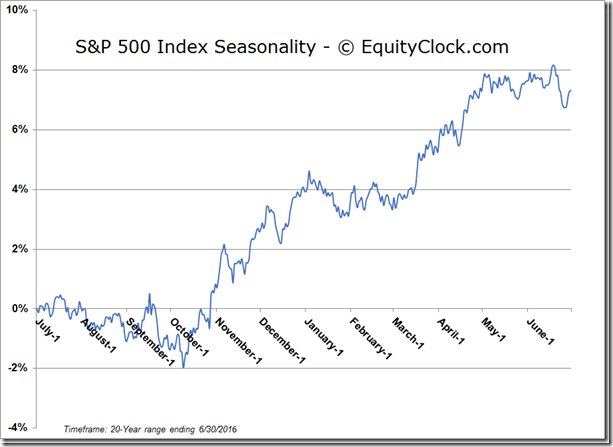
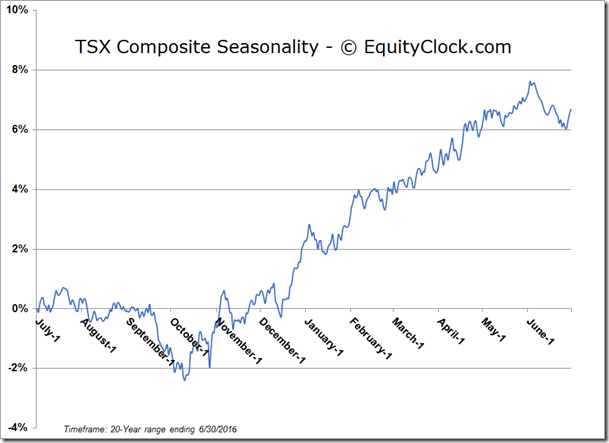
Seasonal influences for U.S. and Canadian equity indices historically have been positive during the first half of July in anticipation of encouraging second quarter results. However, second quarter results this year is expected to be mixed at best. Consensus for S&P 500 companies is for a 5.3% drop by earnings on a year-over-year basis and a 0.8% decline in sales. Among S&P 500 companies, 81 companies have issued negative guidance for the second quarter and 32 companies have issued positive guidance. Consensus for Dow Jones Industrial Average companies is an average (median) gain in earnings per share of 2.1%. Consensus for TSX 60 companies is an average (median) gain in earnings per share of 0.68%.
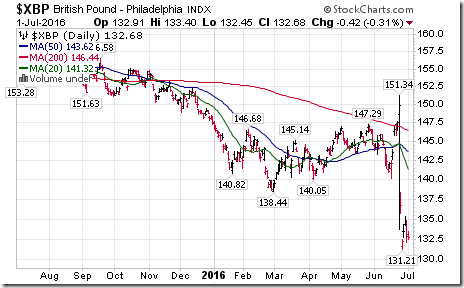
Beyond second quarter results, prospects for the second half improve. Consensus is that S&P 500 earnings on a year-over-year basis will increase 0.8% in the third quarter and 7.3% in the fourth quarter while revenues are expected to increase 2.2% in the third quarter and 5.1% in the fourth quarter. However, a word of caution! Consensus estimates for the third and fourth quarter continue to drop and a likely to decline further when second quarter results are released. A major reason for the decline is Brexit and its impact on the British Pound. Major international companies with head offices in Canada and U.S. will be hit by the recent drop in the British Pound.
Beyond the middle of July, seasonal influences for U.S. and Canadian equity markets turn neutral/negative.
Intermediate term technical indicators for North American equity indices have returned to overbought levels
Short term momentum indicators for most world equity indices, commodities and sectors are trending up, but are at or near overbought levels.
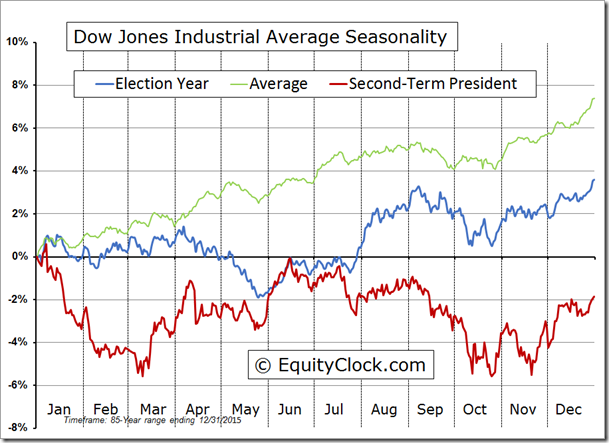
Historically, the Dow Jones Industrial Average on average reached a seasonal peak in mid-June in Presidential election years following a two term President. U.S. equity markets subsequently move lower until near Election Day. Note the slight recovery just prior to the Democrat and Republic convention dates near the end of July followed by a resumption of a downtrend thereafter.
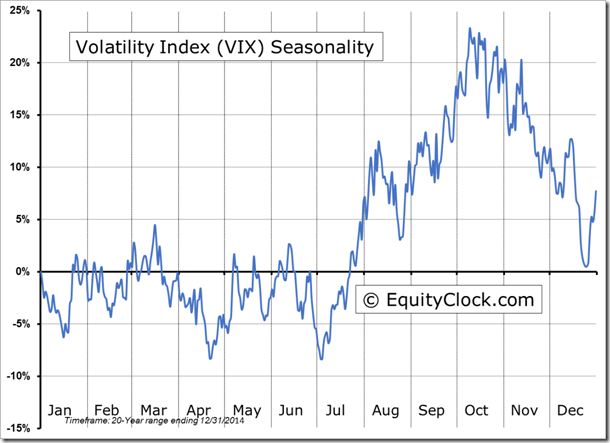
The VIX Index is a key indicator to watch from its low in early July to its high in mid-October. See end of this report for a seasonality chart on VIX. Maintenance of a low VIX Index below 20% implies stable equity indices. However, an unexpected international/political event that spikes the Index above the 20% level in the summer indicates start of an intermediate correction. An event has happened during each of the past nine summers. Caveat emptor!
Equity Indices and related ETFs
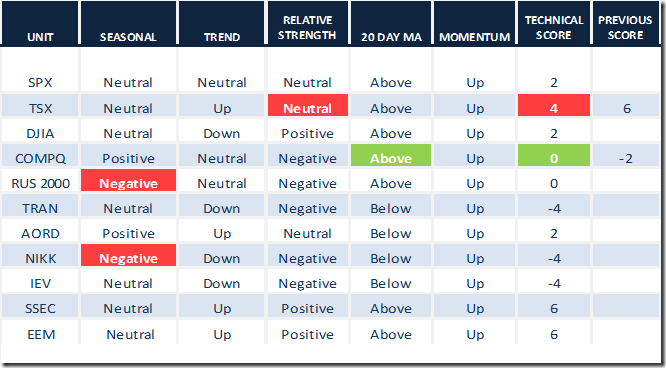
Daily Seasonal/Technical Equity Trends for July 1st 2016
Green: Increase from previous day
Red: Decrease from previous day
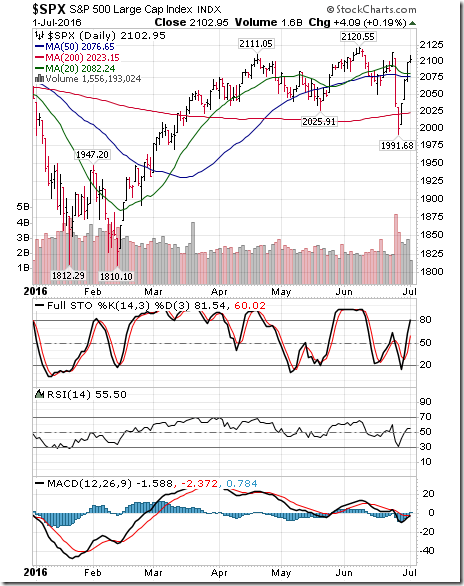
The S&P 500 Index gained 65.65 points (3.22%) last week. Intermediate trend changed to neutral from up on a move below 2025.91. The Index recovered above its 20 day moving average. Short term momentum indicators turned upward.
Calculating Technical Scores
Technical scores are calculated as follows:
Intermediate Uptrend based on at least 20 trading days: Score 2
Higher highs and higher lows
Intermediate Neutral trend: Score 0
Not up or down
Intermediate Downtrend: Score -2
Lower highs and lower lows
Outperformance relative to the S&P 500 Index: Score: 2
Neutral Performance relative to the S&P 500 Index: 0
Underperformance relative to the S&P 500 Index: Score –2
Above 20 day moving average: Score 1
At 20 day moving average: Score: 0
Below 20 day moving average: –1
Up trending momentum indicators (Daily Stochastics, RSI and MACD): 1
Mixed momentum indicators: 0
Down trending momentum indicators: –1
Technical scores range from -6 to +6. Technical buy signals based on the above guidelines start when a security advances to at least 0.0, but preferably 2.0 or higher. Technical sell/short signals start when a security descends to 0, but preferably -2.0 or lower.
Long positions require maintaining a technical score of -2.0 or higher. Conversely, a short position requires maintaining a technical score of +2.0 or lower.
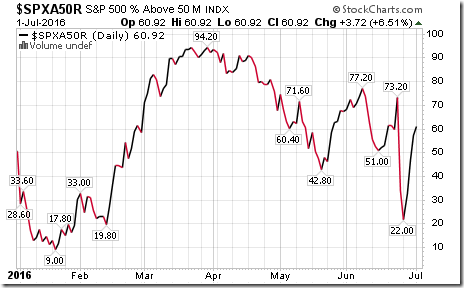
Percent of S&P 500 stocks trading above their 50 day moving average (Also known as the S&P 500 Momentum Barometer) advanced last week to 60.92 from 34.20. Percent has returned to an intermediate overbought level.
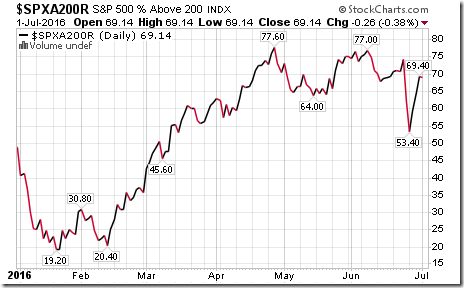
Percent of S&P 500 stocks trading above their 200 day moving average increased last week to 69.14 from 62.20. Percent remains intermediate overbought.
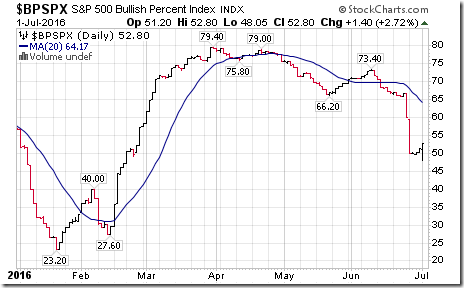
Bullish Percent Index for S&P 500 stocks slipped last week to 52.80% from 60.00% and remained below its 20 day moving average. Percent remains intermediate overbought and trending down.
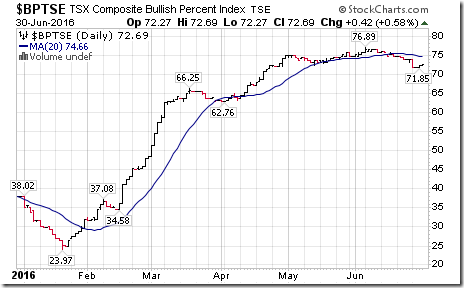
Bullish Percent Index for TSX Composite stocks slipped last week to 72.69% from 73.95% and remained below its 20 day moving average. Percent remains intermediate overbought and trending down
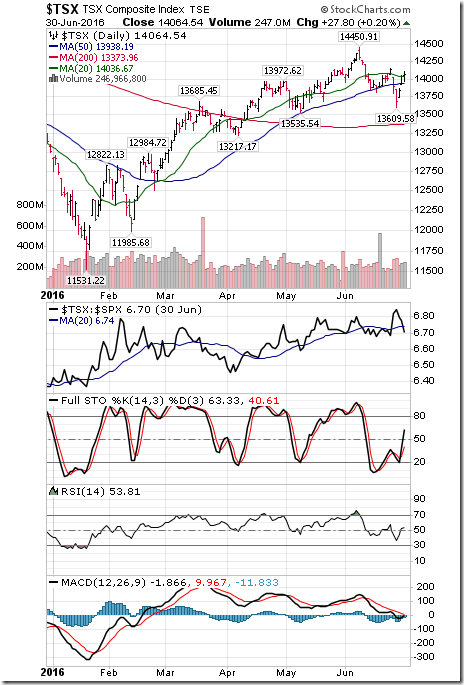
The TSX Composite Index added 172.66 points (1.24%) last week. Intermediate trend remains up (Score: 2). Strength relative to the S&P 500 Index turned neutral from positive on Friday (Score: 0). The Index recovered above is 20 day moving average on Friday (Score: 1). Short term momentum indicators have turned up (Score: 1). Technical score improved last week to 4 from 2.
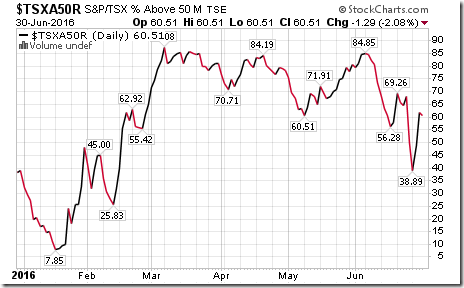
Percent of TSX stocks trading above their 50 day moving average increased last week to 60.51% from 50.00%. Percent has returned to an intermediate overbought level.
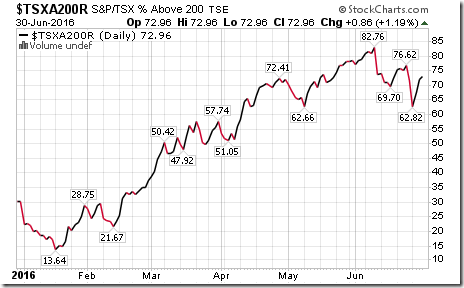
Percent of TSX stocks trading above their 200 day moving average increased last week to 72.96% from 71.55%. Percent remains intermediate overbought and trending down.
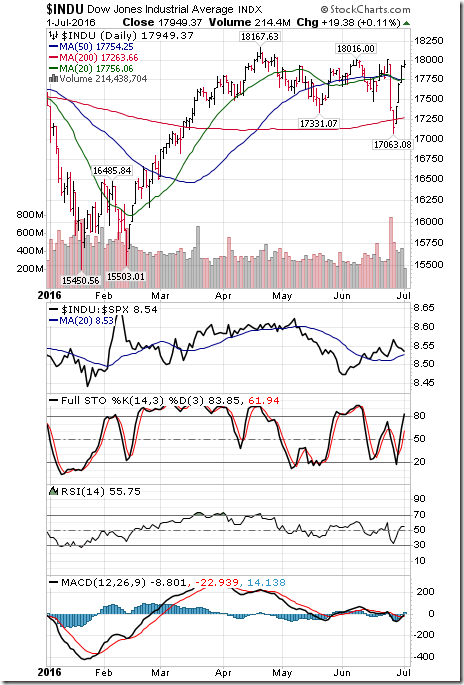
The Dow Jones Industrial Average gained 549.51 points (3.16%) last week. Intermediate trend changed to down from neutral on a move below 17, 331.07. Strength relative to the S&P 500 Index remained positive. The Average recovered to above its 20 day moving average. Short term momentum indicators are trending up. Technical score improved last week to 2 from 0
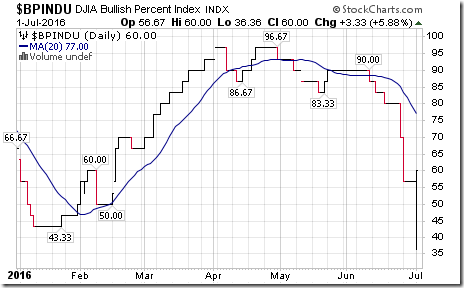
Bullish Percent Index for Dow Jones Industrial Average stocks dropped last week to 60.00% from 70.00% and remained below its 20 day moving average. The Index remains intermediate overbought and trending down.
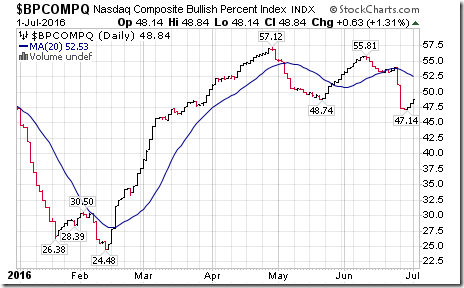
Bullish Percent Index for NASDAQ Composite stocks slipped last week to 48.84% from 51.22% and remained below its 20 day moving average. The Index has dropped to neutral from overbought and continues to trend down.
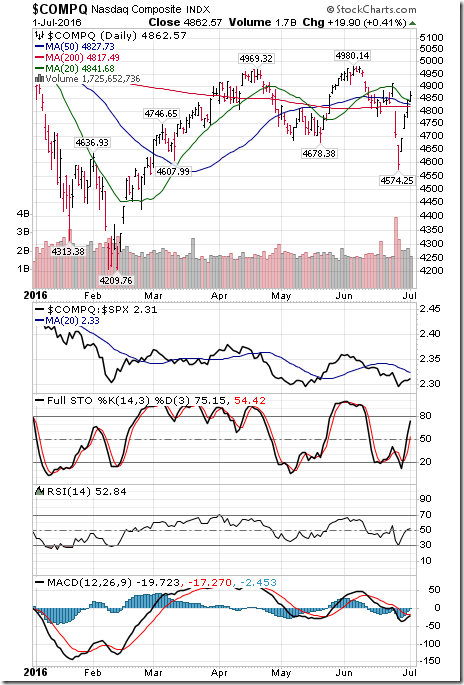
The NASDAQ Composite Index added 154.59 points (3.28%) last week. Intermediate trend changed last week to neutral from up on a move below 4,678.38. Strength relative to the S&P 500 Index remains negative. The Index moved above its 20 day moving average on Friday. Short term momentum indicators have turned up. Technical score improved last week to 0 from -2
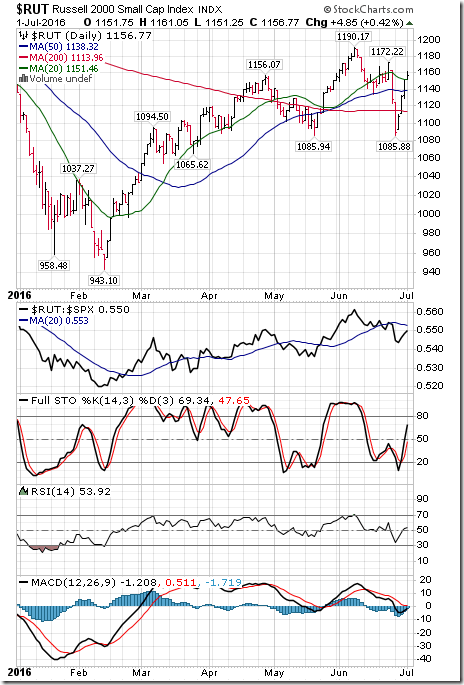
The Russell 2000 Index gained 29.23 points (2.59%) last week. Intermediate trend changed to neutral from up on a move below 1,085.94. Strength relative to the S&P 500 Index changed to negative from neutral. The Index moved above its 20 day moving average on Friday. Short term momentum indicators have turned up. Technical score remained last week at 0.
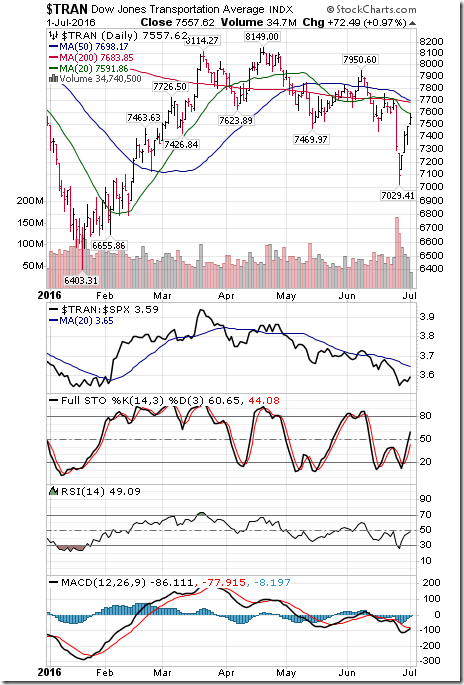
The Dow Jones Transportation Average gained 236.92 points (3.24%) last week. Intermediate trend remains down. Strength relative to the S&P 500 Index remains negative. The Average remained below its 20 day moving average. Short term momentum indicators have turned up. Technical score improved last week to -4 from -6.
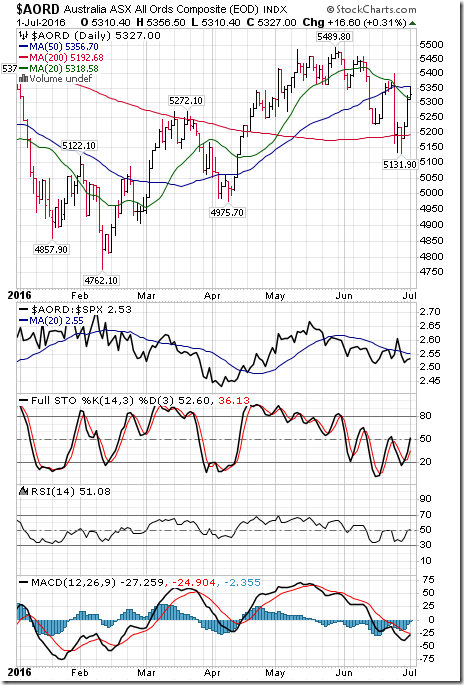
The Australia All Ordinaries Composite Index gained 134.20 points (2.58%) last week. Intermediate trend remains up. Strength relative to the S&P 500 Index improved to neutral from negative. The Index remained below its 20 day moving average. Short term momentum indicators are trending up. Technical score improved last week to 2 from -2.
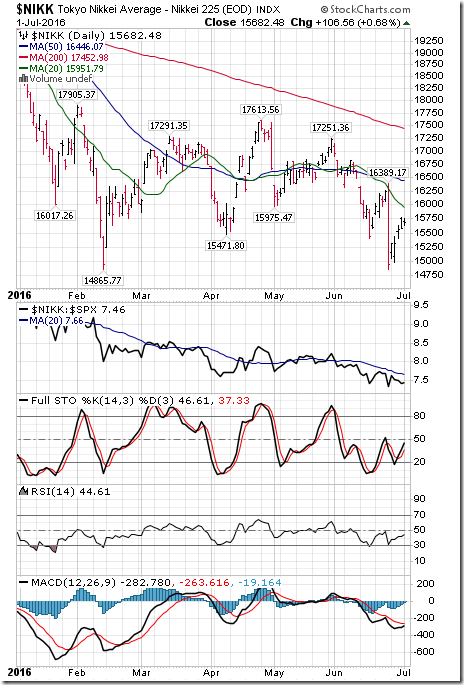
The Nikkei Average added 730.46 points (4.89%) last week. Intermediate trend remains down. Strength relative to the S&P 500 Index remains negative. The Average remains below its 20 day moving average. Short term momentum indicators have turned up. Technical score improved last week to -4 from -6
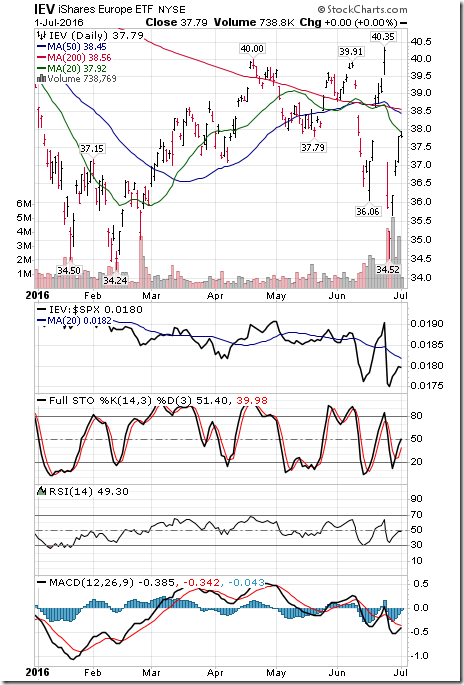
Europe iShares advanced $1.92 (5.35%) last week. Intermediate trend remains down. Strength relative to the S&P 500 remains negative. Units remain below their 20 day moving average. Short term momentum indicators have turned up. Technical score improved last week to -4 from -6.
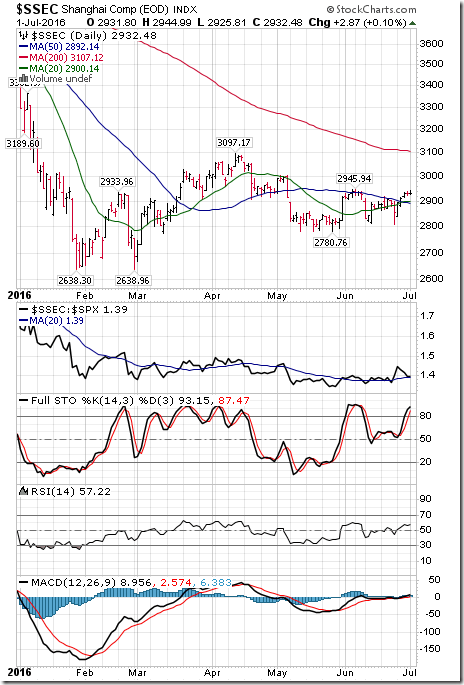
The Shanghai Composite Index added 78.19 points (2.74%) last week. Intermediate trend remains up. Strength relative to the S&P 500 Index changed to positive from neutral. The Index moved above its 20 day moving average. Short term momentum indicators are trending up. Technical score improved last week to 6 from 0.
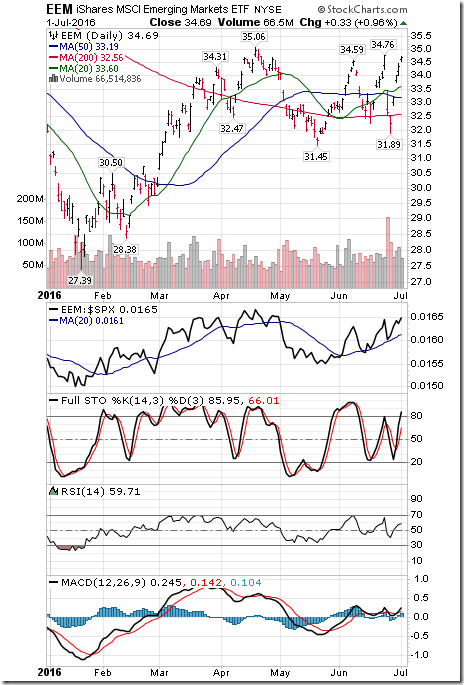
Emerging markets iShares gained $2.04 (6.25%) last week. Intermediate trend remains up. Strength relative to the S&P 500 Index remained positive. Units moved above their 20 day moving average. Short term momentum indicators are trending up. Technical score improved last week to 6 from 2
Currencies
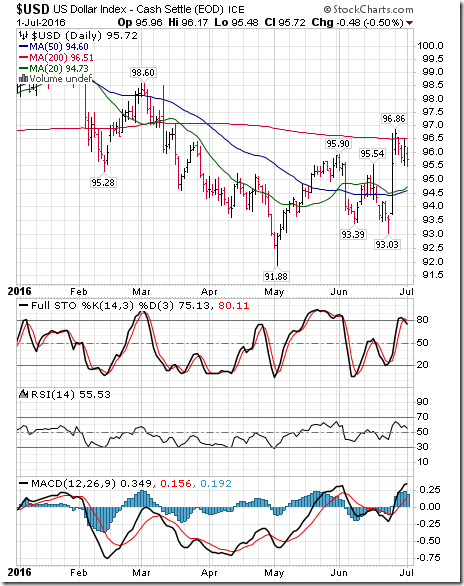
The U.S. Dollar Index added 0.09 (0.09%) last week. Intermediate trend remains up. The Index remains above its 20 day moving average. Short term momentum indicators are trending up, but are overbought.
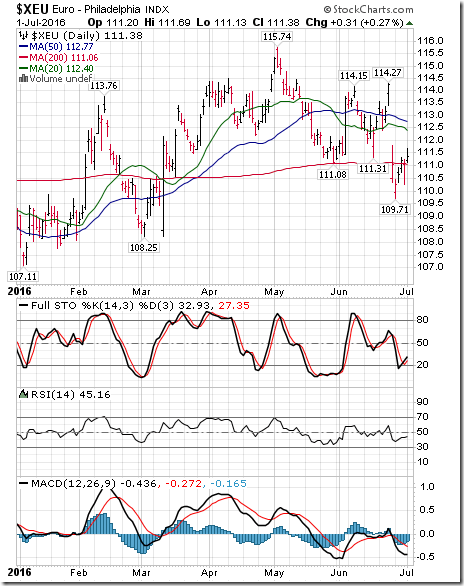
The Euro added 0.28 (0.25%) last week. Intermediate trend remains down. The Euro remains below its 20 day moving average. Short term momentum indicators are trending down, but showing early signs of bottoming.
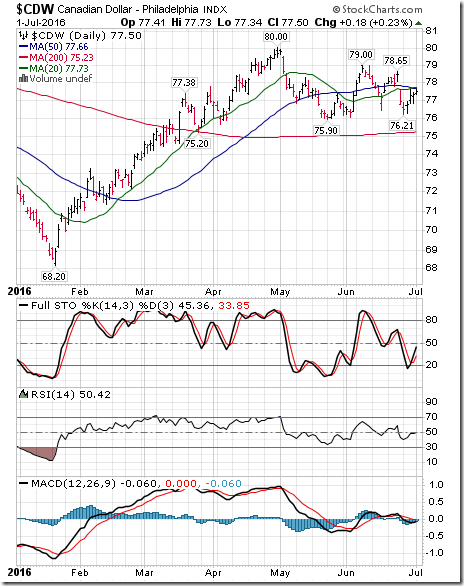
The Canadian Dollar added US 0.50 cents (0.65%) last week. Intermediate trend remains up. The Canuck Buck remains below its 20 day moving average. Short term momentum indicators are trending up.
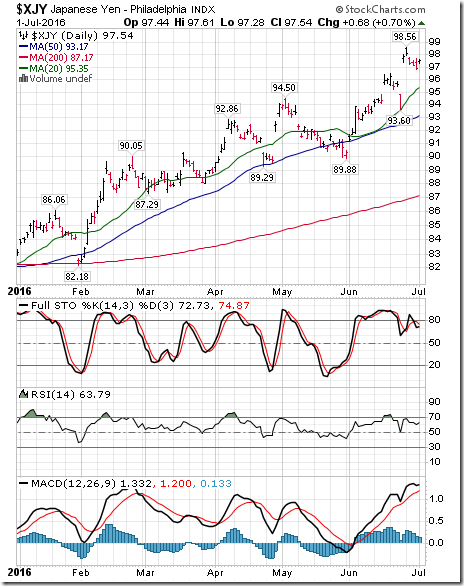
The Japanese Yen slipped 0.14 (0.14%) last week. Intermediate trend remains up. The Yen remains above its 20 day moving average. Short term momentum indicators are overbought and showing early signs of rolling over.
Commodities
Daily Seasonal/Technical Commodities Trends for July 1st 2016
Green: Increase from previous day
Red: Decrease from previous day
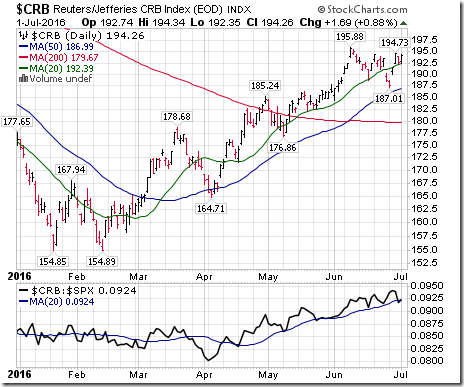
The CRB Index added 5.57 points (2.95%) last week. Intermediate trend remains up. Strength relative to the S&P 500 Index remains positive. Strength relative to the S&P 500 Index remains positive. The Index moved back above its 20 day moving average. Short term momentum indicators are trending up. Technical score improved last week to 6 from 2.
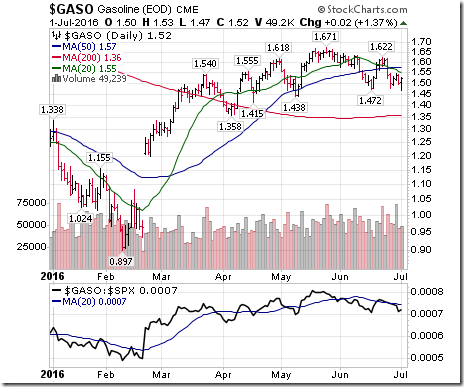
Gasoline slipped $0.01 per gallon (0.65%) last week. Intermediate trend remains up. Strength relative to the S&P 500 Index remains negative. Gas remains below its 20 day moving average. Short term momentum indicators are trending down. Technical score remained last week at -2.
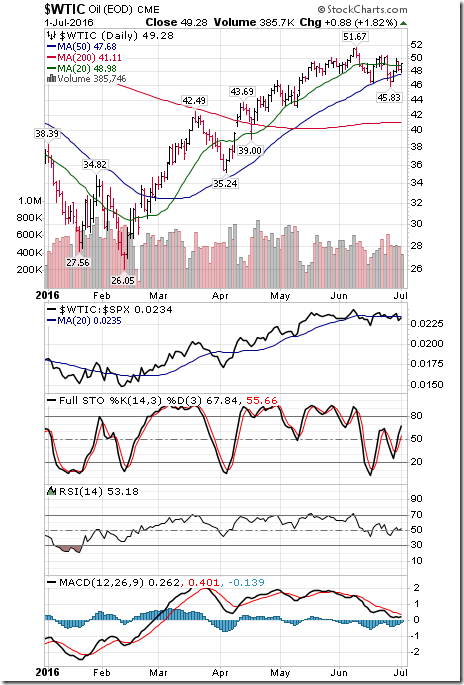
Crude Oil added $1.64 per barrel (3.44%) last week. Intermediate trend remains up. Strength relative to the S&P 500 Index remains neutral. Crude moved above its 20 day moving average on Friday. Short term momentum indicators are trending up. Technical score improved last week to 4 from 0.
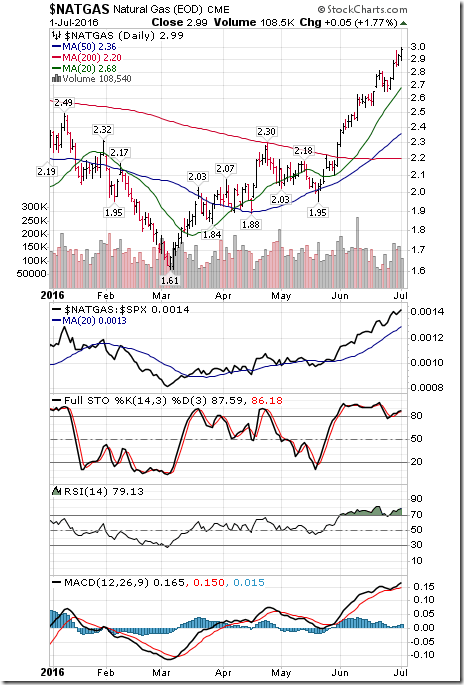
Natural Gas gained $0.30 per MBtu (11.15%) last week thanks to warmer than average weather that triggered greater demand for power used for air conditioning. Intermediate trend remains up. “Natty” remains above its 20 day moving average. Short term momentum indicators are trending up. Technical score increased last week to 6 from 4.
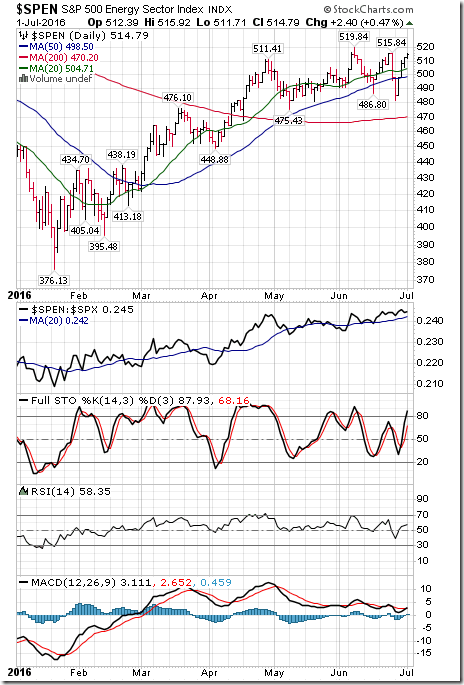
The S&P Energy Index added 17.07 points (3.43%) last week. Intermediate trend remains up. Strength relative to the S&P 500 Index remained positive. The Index moved above its 20 day moving average. Short term momentum indicators are trending up. Technical score improved last week to 6 from 2.
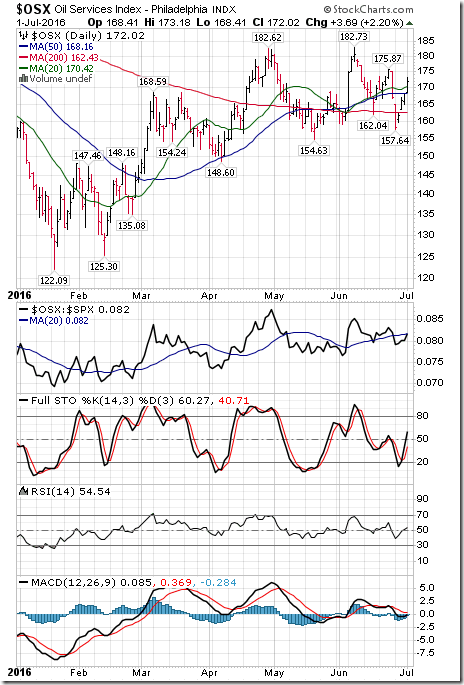
The Philadelphia Oil Services Index added 5.05 points (3.02%) last week. Intermediate trend remains up. Strength relative to the S&P 500 Index changed to neutral. The Index moved above its 20 day moving average on Friday. Short term momentum indicators are trending up. Technical score improved last week to 4 from 2.
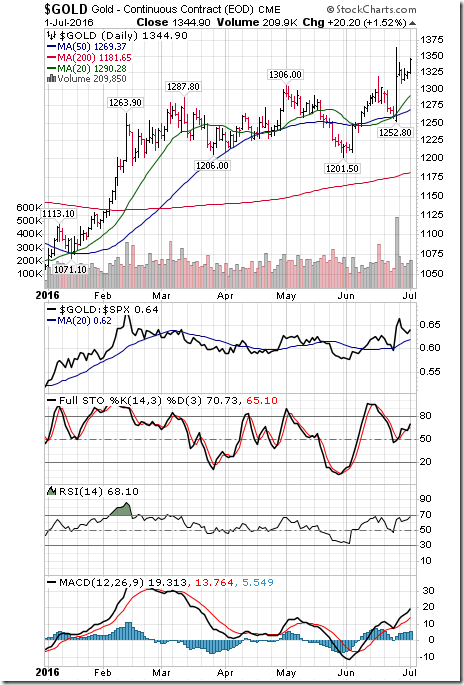
Gold gained $22.50 per ounce (1.70%) last week. Intermediate trend remains up. Strength relative to the S&P 500 Index remains positive. Gold remained above its 20 day moving average. Short term momentum indicators are trending up. Technical score remained last week at 6.
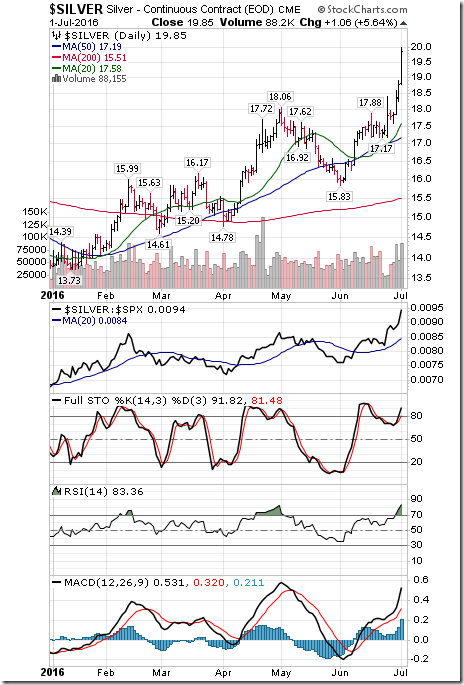
Silver jumped $2.01 per ounce (11.27%) last week. Intermediate trend remains up. Strength relative to the S&P 500 Index remains positive. Silver remains above its 20 day moving average. Short term momentum indicators are trending up. Technical score remained last week at 6.
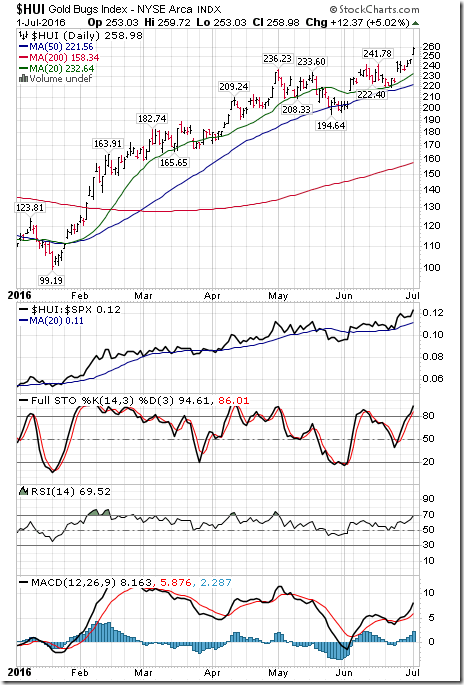
The AMEX Gold Bug Index added 21.10 points (8.87%) last week. Intermediate trend remains up. Strength relative to the S&P 500 Index remains positive. The Index remains above its 20 day moving average. Short term momentum indicators are trending up. Technical score remained last week at 6.
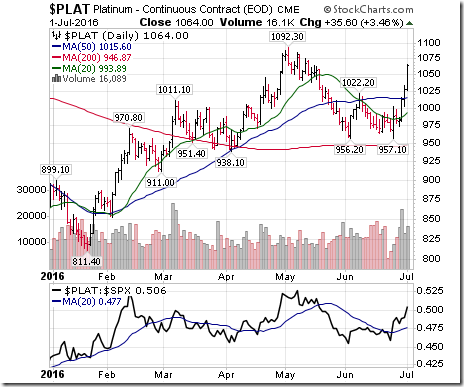
Platinum gained $75.90 per ounce (7.68%) last week. Trend remains neutral. Relative strength remains positive. PLAT remains above its 20 day MA. Momentum remains up. Score: remains 4
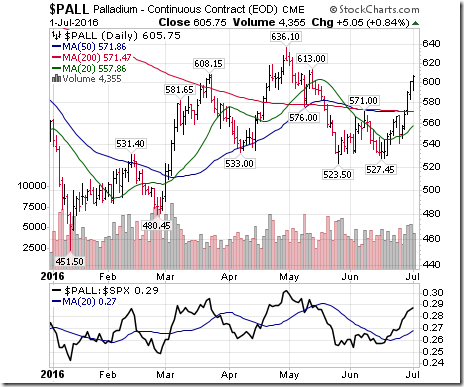
Palladium gained $59.30 per ounce (10.85%) last week. Intermediate trend remains neutral. Strength relative to the S&P 500 Index remains positive. PALL moved above its 20 day moving average last week. Short term momentum indicators are trending up. Technical score: 4
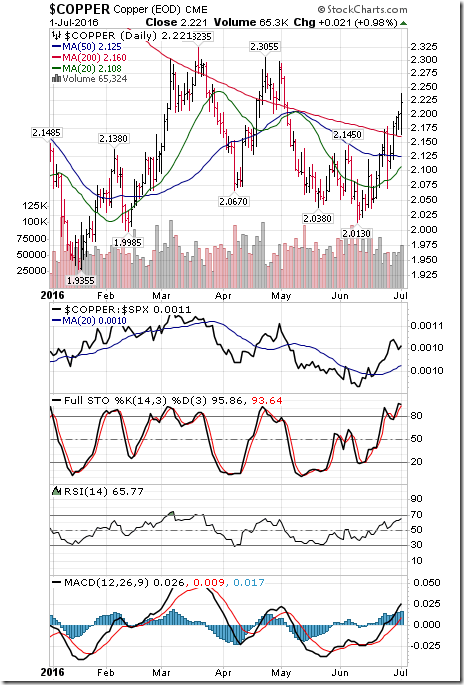
Copper added $1.05 per lb. (4.96%) last week. Intermediate trend remains neutral. Strength relative to the S&P 500 Index remains positive. Copper remains above its 20 day moving average. Short term momentum indicators are trending up. Technical score increased last week to 4 from 2.
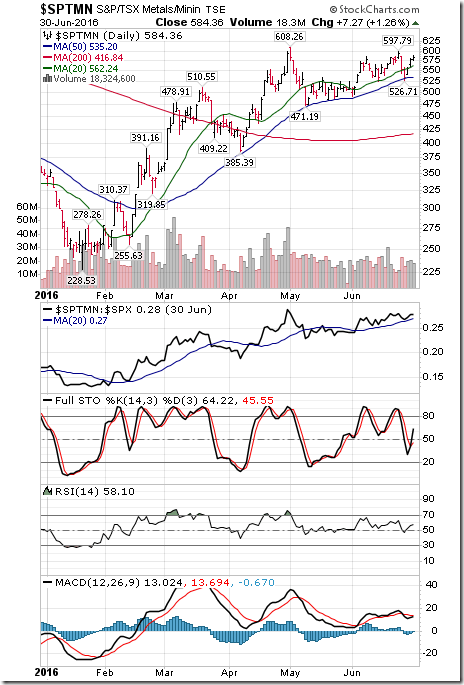
The TSX Metals & Mining Index gained 30.04 points (5.42%) last week. Intermediate trend remains up. Strength relative to the S&P 500 Index remains positive. The Index remained above its 20 day moving average. Short term momentum indicators are trending up. Technical score improved last week to 6 from 4.
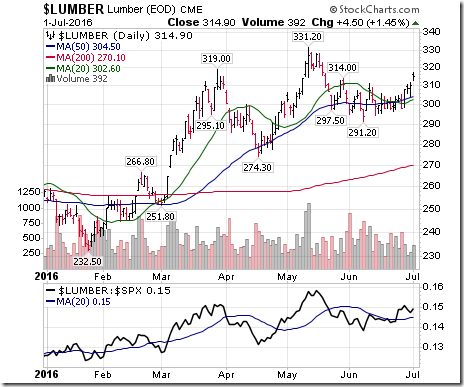
Lumber added 19.40 (6.57%) last week. Trend remains up. Relative strength improved to neutral. Lumber moved above its 20 day MA. Momentum turned positive. Score: 4
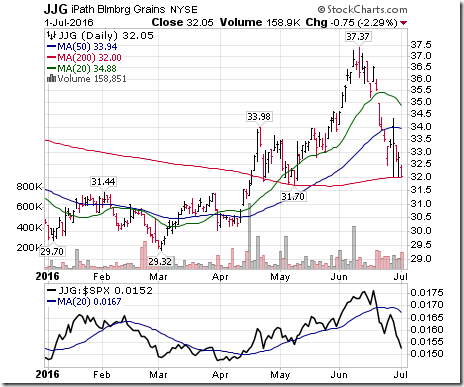
The Grain ETN dropped $1.15 (3.36%) last week. Intermediate trend remains up. Strength relative to the S&P 500 Index remains negative. Units remained below their 20 day moving average. Short term momentum indicators are trending down. Technical score remained at 2
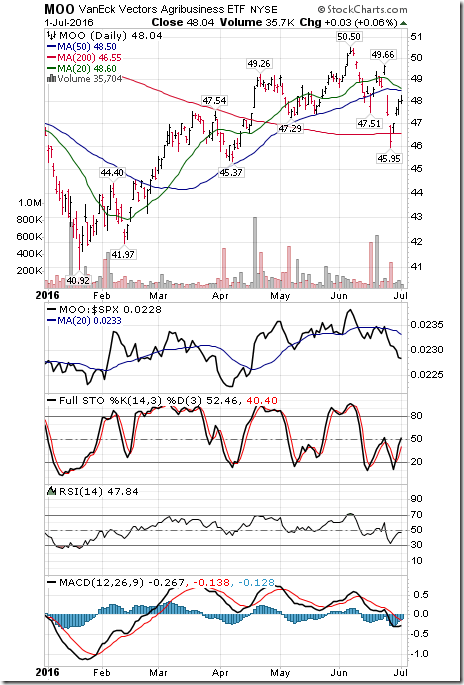
The Agriculture ETF gained $0.62 (1.31%) last week. Intermediate trend changed to neutral from up on a move below $47.29. Strength relative to the S&P 500 Index changed to negative to neutral. Units remained below their 20 day moving average. Short term momentum indicators are trending up. Technical score slipped to -2 from 0.
Interest Rates
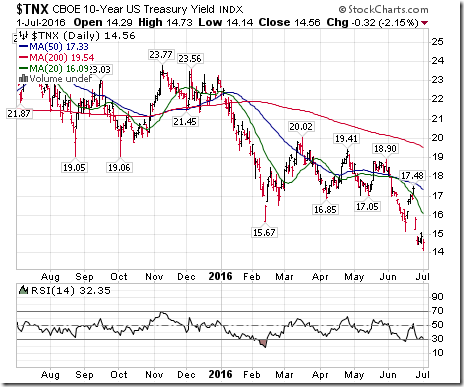
Yield on 10 year Treasuries dropped 12.3 basis points (7.79%) last week. Intermediate trend remains down. Yield remained below its 20 day moving average. Short term momentum indicators are trending down, but are oversold.
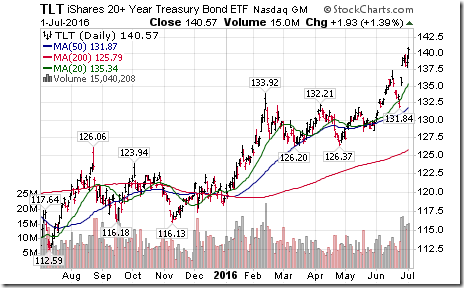
Conversely, price of the long term Treasury ETF added $4.79 (3.53%) last week. Intermediate trend remains up. Units remain above their 20 day moving average.
Volatility
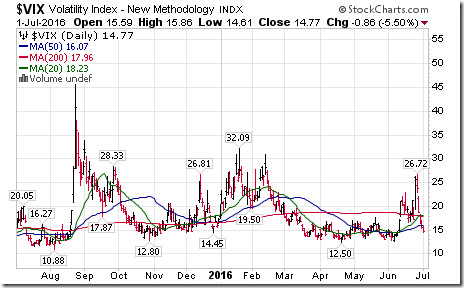
The VIX Index plunged 10.01 (40.40%) last week. Intermediate trend remains up. However, the Index dropped below its 20, 50 and 200 day moving average.
Sectors
Daily Seasonal/Technical Sector Trends for March July 1st 2016
Green: Increase from previous day
Red: Decrease from previous day
StockTwits Released on Friday
S&P 500 has averaged a gain of 0.4% in July, the result of strength in the first half of the month.
Technical action by S&P 500 stocks to 10:15: Bullish. Breakouts: $CBS, $NKE, $PHM. $CNX, $AON, $MCK, $UTX, $ATVI, $GGP.
Editor’s Note: After 10:15 another 7 S&P 500 stocks broke resistance: HOG, WYN, ABT, CERN, GWW , YHOO and PFE.
Nice breakout by Metals & Mining SPDRs $XME above $20.05 extending intermediate uptrend.
Nice breakout by Nickel ETN above $$11.51 completing base building pattern.
Special Free Services available through www.equityclock.com
Equityclock.com is offering free access to a data base showing seasonal studies on individual stocks and sectors. The data base holds seasonality studies on over 1000 big and moderate cap securities and indices. To login, simply go to http://www.equityclock.com/charts. Following is an example:
WALL STREET RAW RADIO WITH MARK LEIBOVIT – JULY 2, 2016
WITH SPECIAL GUESTS SINCLAIR NOE AND HENRY WEINGARTEN
Disclaimer: Seasonality and technical ratings offered in this report by www.timingthemarket.ca and www.equityclock.com are for information only. They should not be considered as advice to purchase or to sell mentioned securities. Data offered in this report is believed to be accurate, but is not guaranteed
Copyright © DV Tech Talk, Timingthemarket.ca


![clip_image002[5] clip_image002[5]](https://advisoranalyst.com/wp-content/uploads/2019/08/af38e6160e41931a083f890199d3f39b.png)
![clip_image002[7] clip_image002[7]](https://advisoranalyst.com/wp-content/uploads/2019/08/35eb832205c902f4732744a26869c0b7.png)
