The U.S. is Richer Than Ever
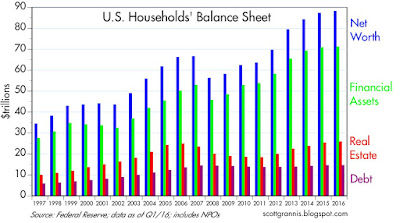
Today the Fed released its latest estimate of the balance sheet of U.S. households. Collectively, our net worth reached a new high in nominal, real, and per capita terms. We are living in the weakest recovery ever, and things could and should be a lot better, but it is still the case that today we are better off than ever before.
As of March 31, 2016, the net worth of U.S. households (including that of Non-Profit Organizations, which presumably exist for the benefit of all) reached a staggering $88.1 trillion. To put that in perspective, it's about 40% more than the value of all global equity markets, which were worth $62.8 trillion at the end of March according to Bloomberg.
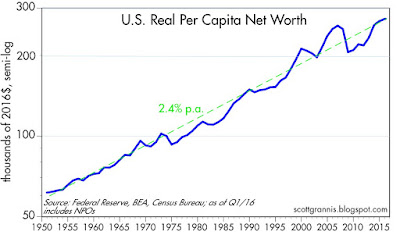
On a real, per capita basis, the net worth of the average person living in the U.S. reached a new all-time high of $273,560. This measure of wealth has been rising, on average, about 2.4% per year since records were first kept beginning in 1951. Life in the U.S. has been getting better and better for generations. If you're hungry for more details of the steady march of progress, check out Human Progress, a worthwhile project of Cato, my favorite think-tank.
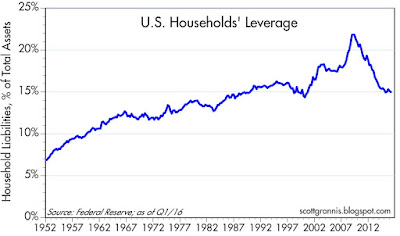
The ongoing accumulation of wealth is not a house of cards built on a bulging debt bubble either, regardless of what you might hear from the scaremongers. The typical household has cut its leverage by over 30% (from 22% to 15%) since the onset of the Great Recession in 2008. Household liabilities today are the same as they were in early 2008 (about $14.5 trillion), but financial assets have increased by one-third since then, thanks to significant gains in savings deposits, bonds, and equities. Since the peak of the housing market in 2006, the value of households' real estate holdings has not only fully recovered, but has grown by almost 4%. Moreover, the Federal Reserve calculates that owners' equity in real estate has returned to its 2006 high ($13 trillion), having more than doubled since its mid-2009 low.


