by Don Vialoux, Timingthemarket.ca
Pre-opening Comments for Tuesday May 31st
U.S. equity index futures were higher this morning. S&P 500 futures were up 3 points in pre-opening trade.
Index futures were virtually unchanged following release of economic news released at 8:30 AM EDT. Consensus for April Personal Income was an increase of 0.4% versus 0.4% in March. Actual was a gain of 0.4%. Consensus for April Personal Spending was an increase of 0.7% versus a gain of 0.1% in March. Actual was an increase of 1.0%
The Canadian Dollar dropped US 0.26 cents to 76.53 following release of Canadian first quarter real GDP at 8:30 AM EDT. Consensus was growth at a 2.8% rate versus a downwardly revised fourth quarter rate at 0.5%. Actual was growth at a 2.4% rate. March GDP dropped 0.2% versus consensus for a decline of 0.1%.
Bank of Nova Scotia (BNS ) is expected to open higher after reporting higher than consensus fiscal second quarter operating earnings.
Medtronic gained $0.55 to $82.24 after reporting higher than consensus fiscal fourth quarter results.
Micron gained $0.45 to $12.77 after RW Baird upgraded the stock to Outperform from Neutral. Target was raised to $18 from $12.
Michael Kors (KORS $41.79) is expected to open lower after Wedbush lowered its target price to $43 from $52.
EquityClock’s Daily Market Comment
Following is a link:
http://www.equityclock.com/2016/05/29/stock-market-outlook-for-may-31-2016/
Note seasonality chart on Gold.
Economic News This Week
April Personal Income to be released at 8:30 AM EDT on Tuesday is expected to increase 0.4% versus a gain of 0.4% in March. April Personal Spending is expected to increase 0.7% versus a gain of o0.1% in March.
Cdn. First Quarter Real GDP to be released at 8:30 AM EDT on Tuesday is expected to increase 2.8% versus a gain of 0.8% in the fourth quarter. March Real GDP is expected to slip 0.1% versus a drop of 0.1% in February.
March Case Shiller 20 City Home Price Index to be released at 9:00 AM EDT on Tuesday is expected to increase on a year-over-year basis by 5.1% versus a gain of 5.4% in February.
May Chicago PMI to be released at 9:45 AM EDT on Tuesday is expected to improve to 50.9 from 50.4 in April.
May Consumer Confidence to be released at 10:00 AM EDT on Tuesday is expected to increase to 96.2 from 94.2 in April.
May ADP Private Employment to be released at 8:15 AM EDT on Wednesday is expected to increase to 180,000 from 156,000 in April.
May ISM to be released at 10:00 AM EDT on Wednesday is expected to slip to 50.4 from 50.8 in April
April Construction Spending to be released at 10:00 AM EDT on Wednesday is expected to increase 0.5% from 0.3% in March.
June Beige Book is released at 2:00 AM EDT on Wednesday.
Initial Jobless Claims to be released at 8:30 AM EDT on Thursday are expected to remain unchanged from last week at 268.000.
May Non-farm Payrolls to be released at 8:30 AM EDT on Friday is expected to slip to 155,000 from 160,000 on April. May Private Non-farm Payrolls are expected to slip to 160,000 from 171,000 in April. The May Unemployment Rate is expected to slip to 4.9% form 5.0% in April. May Hourly Earnings are expected to increase 0.2% versus a gain of 0.3% in April.
April Trade Deficit to be released at 8:30 AM EDT on Friday is expected to increase to $41/6 billion from $40.4 billion in March.
Cdn, April Merchandise Deficit to be released at 8:30 AM EDT on Friday is expected to ease to $2.6 billion from $3.4 billion in March.
April Factory Orders to be released at 10:00 AM EDT on Friday are expected to increase 1.6% versus a gain of 1.1% in March.
May ISM Services Index to be released at 10:00 AM EDT on Friday is expected to slip to 55.4 from 55.7 in April.
Earnings Reports This Week
The Bottom Line
Enjoy the gains while they last! Equity markets and economically sensitive sectors recorded impressive gains last week, typical of technical action around the Memorial Day holiday. However, technical action has returned equity markets to short and intermediate overbought levels just below well-defined resistance levels at a time when North American equity indices have a history of reaching a seasonal peak. Taking seasonal profits into strength during the next two weeks makes sense. Selected sectors with strong seasonality are exceptions: Technology and Biotech.
Observations
U.S. and Canadian economic news this week is expected to be modestly positive, confirming slow but steady growth. Focus is on the U.S. employment report on Friday. Discussions by FOMC members about the possibility of a 0.25% increase in the Fed Fund rate on June 15th continue to ramp up. A scheduled comment on the economy by Federal Reserve chairman, Janet Yellen on June 6th could provide additional clues.
Earnings reports released this week are sparse. Focus is on Bank of Nova Scotia
First quarter reports by S&P 500 companies finally are winding down: 98% of companies have reported to date. 72% beat consensus earnings estimates while 53% bear consensus sales. Blended earnings on a year-over year basis fell 6.7% while blended sales dropped 1.5%.
Looking forward, two more S&P 500 companies are scheduled to release first quarter results this week. 80 companies have released negative second quarter earnings guidance to date, while 31 companies have offered positive guidance. Blended earnings in the second quarter are expected to drop 4.8% on a year-over-year basis while sales are expected to slip 1.0%.
According to FactSet, prospects turn positive in the third quarter. Year-over-year earnings are expected to increase 1.4% in the third quarter and 7.5% are expected to increase in the fourth quarter. Sales are expected to increase 2.1% in the third quarter and 4.9% in the fourth quarter.
Short term technical indicators for most equity markets and sectors moved last week from oversold to overbought. However, signs of a roll-over have yet to appear.
Intermediate technical indicators for many equity markets and sectors have returned to overbought levels. Many equity markets (exception: TSX) currently are testing intermediate resistance levels that likely will hold
Discussions during the G7 leaders meeting held over the weekend are not expected to have a significant impact on equity markets.
The Memorial Day trade in U.S. equity indices has been exceptionally profitable this year. The trade started at the beginning of last week and ends on Wednesday June 1st.
“Sell in May and go away” investors are not “happy campers” so far. The traditional sell date for the strategy is May 5th for both Canadian and U.S. equity indices and economically sensitive sectors. Investors who sold on May 5th missed a 1.20% gain by the Dow Jones Industrial Average, the S&P 500 Index added 2.36% and the NASDAQ Composite Index advanced 4.59% and the TSX Composite improved 3.47%. Best performing sector since May 5th was the Technology sector, up 5.77%, a sector that currently is in a period of seasonal strength lasting until mid-July.
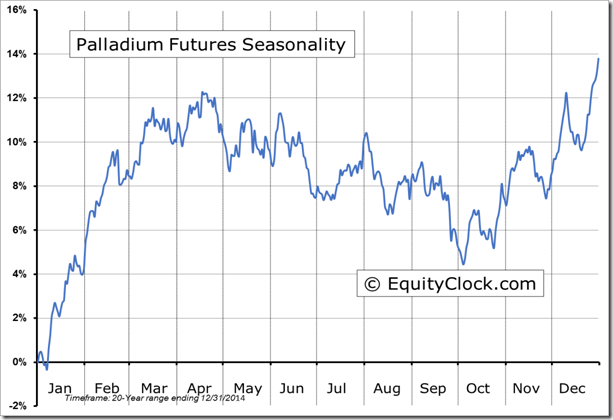
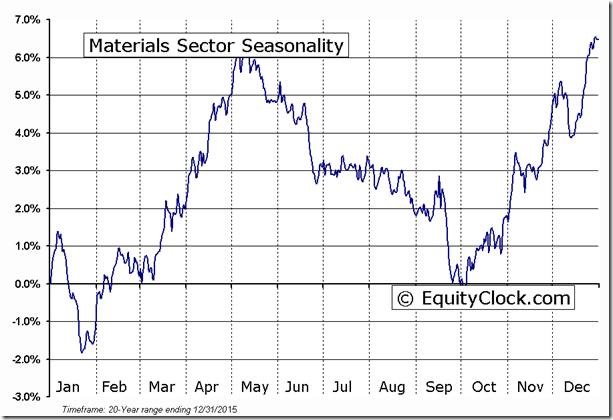
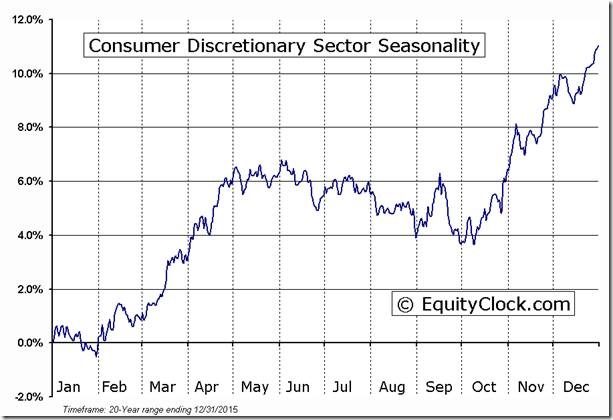
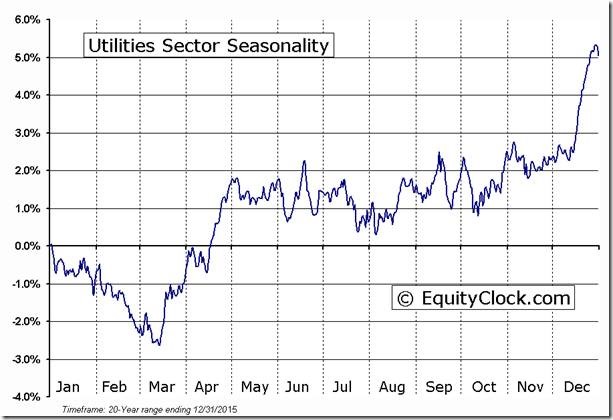
Other sectors and commodities have a history of peaking at this time of year. A list with their seasonality charts are offered below.
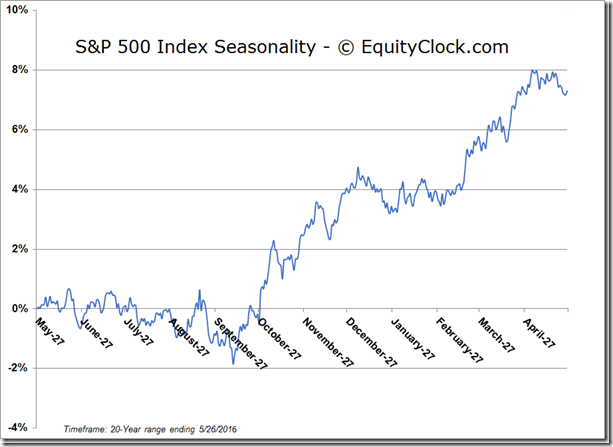
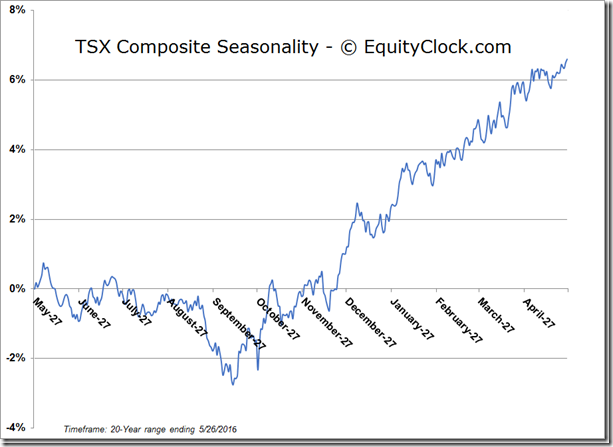
On average during the past 20 years, average optimal day for the S&P 500 Index to reach a seasonal peak is June 8th and the average optimal day for the TSX Composite Index is June 4th. Given the short term overbought level of both equity markets, chances are high that the optimal day this year will be close to the average.
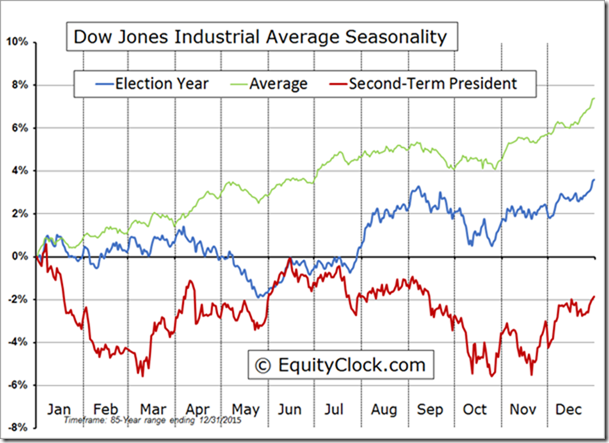
The Dow Jones Industrial Average during a Presidential election year after a second term president has a history of reaching a seasonal peak in mid-June.
Equity Indices and Related ETFs
Daily Seasonal/Technical Equity Trends for May 30th 2016
Green: Increase from previous day
Red: Decrease from previous day
Calculating Technical Scores
Technical scores are calculated as follows:
Intermediate Uptrend based on at least 20 trading days: Score 2
Higher highs and higher lows
Intermediate Neutral trend: Score 0
Not up or down
Intermediate Downtrend: Score -2
Lower highs and lower lows
Outperformance relative to the S&P 500 Index: Score: 2
Neutral Performance relative to the S&P 500 Index: 0
Underperformance relative to the S&P 500 Index: Score –2
Above 20 day moving average: Score 1
At 20 day moving average: Score: 0
Below 20 day moving average: –1
Up trending momentum indicators (Daily Stochastics, RSI and MACD): 1
Mixed momentum indicators: 0
Down trending momentum indicators: –1
Technical scores range from -6 to +6. Technical buy signals based on the above guidelines start when a security advances to at least 0.0, but preferably 2.0 or higher. Technical sell/short signals start when a security descends to 0, but preferably -2.0 or lower.
Long positions require maintaining a technical score of -2.0 or higher. Conversely, a short position requires maintaining a technical score of +2.0 or lower.
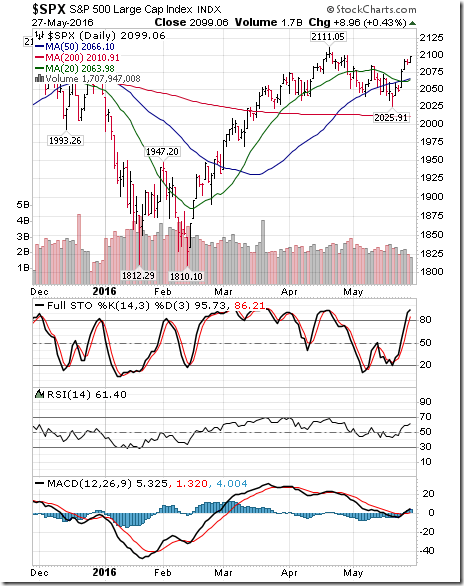
The S&P 500 Index gained 46.74 points (2.28%) last week. Intermediate trend improved to Neutral on a move above 2,084.87. The Index moved above its 20 day moving average last week. Short term momentum indicators changed from downtrends to uptrends and currently are overbought. However, signs of a short term peak have yet to surface.
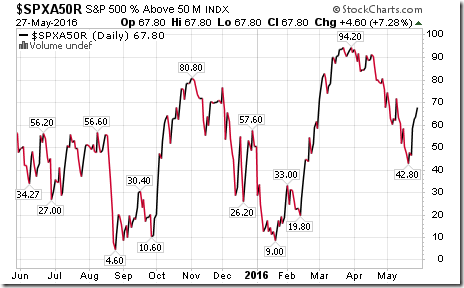
Percent of S&P 500 stocks trading above their 50 day moving average (Also known as the S&P Momentum Barometer) rose last week to 67.80% from 48.00%. Percent has returned to an intermediate overbought level.
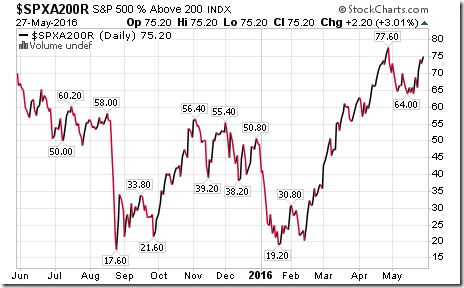
Percent of S&P 500 stocks trading above their 200 day moving average increased last week to 75.20% from 68.80%. Percent has returned to a high intermediate overbought level.
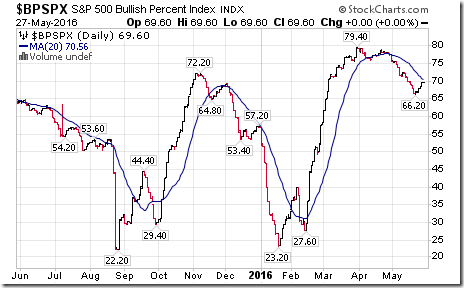
Bullish Percent Index for S&P 500 stocks increased last week to 69.80% from 67.00%, but remained below its 20 day moving average. The Index remains intermediate overbought and trending down.
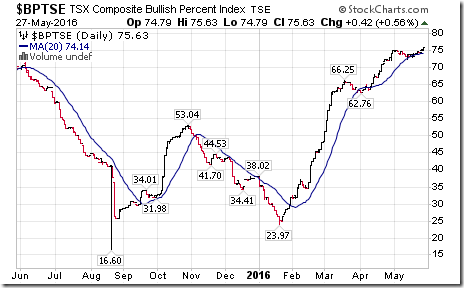
Bullish Percent Index for TSX Composite stocks increased last week to 75.63% from 74.38% and remained above its 20 day moving average. The Index is intermediate overbought, but continues to trend higher.
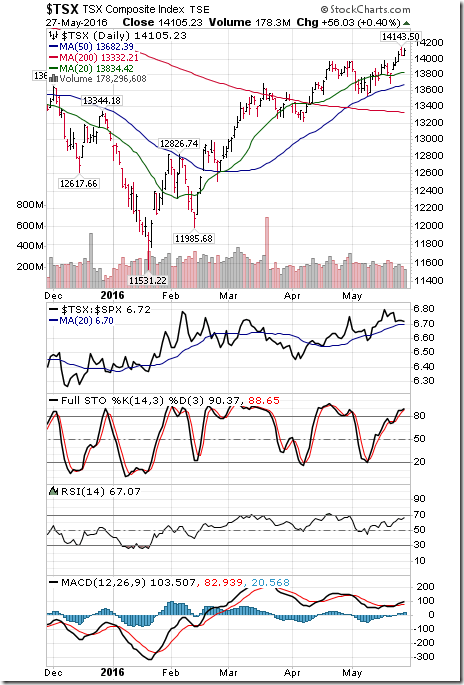
The TSX Composite Index added 185.65 points (1.33%) last week. Intermediate trend remains up (Score: 2). Strength relative to the S&P 500 Index remains positive (Score: 2). The Index remained above its 20 day moving average (Score: 1). Short term momentum indicators are trending up (Score: 1). Technical score remained last week at 6.
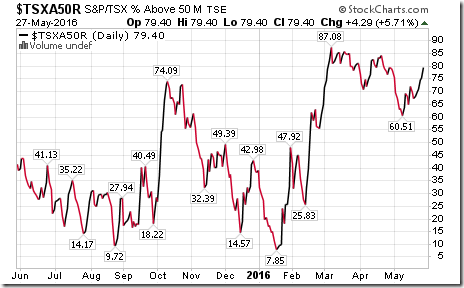
Percent of TSX stocks trading above their 50 day moving average (Also known as the TSX Composite Momentum Barometer) increased last week to 79.40% from 70.21%. Percent remains intermediate overbought.
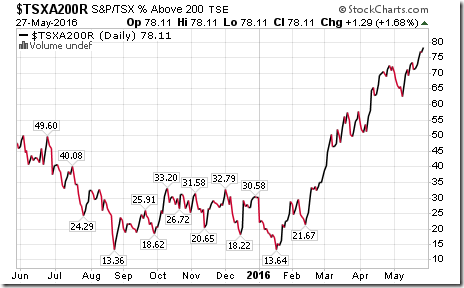
Percent of TSX stocks trading above their 200 day moving average increased last week to 78.11% from 72.77%. Percent remains intermediate overbought, but continues to trend higher.
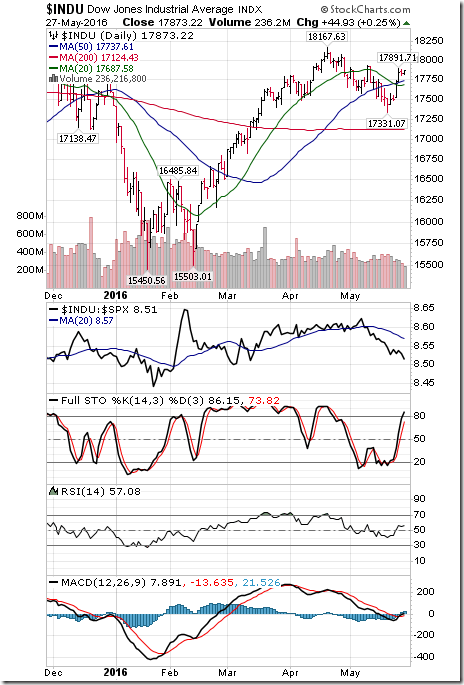
The Dow Jones Industrial Average added 372.28 points (2.13%) last week. Intermediate trend remained down. Strength relative to the S&P 500 Index remained negative. The Average moved above it 20 day moving average last week. Short term momentum indicator trend changed to up from down and are overbought. However, signs of a peak have yet to appear.
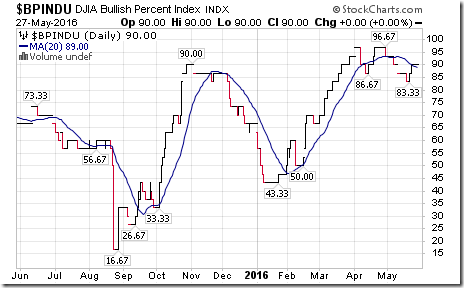
Bullish Percent Index for Dow Jones Industrial Average stocks increased last week to 90.00% from 86.67% and moved above its 20 day moving average. The Index remains intermediate overbought.
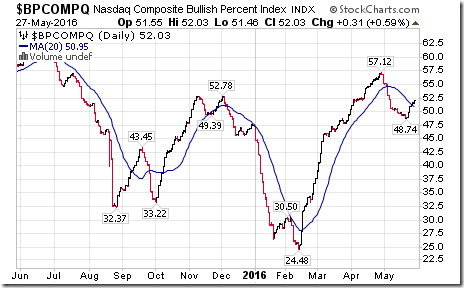
Bullish Percent Index for NASDAQ Composite stocks increased last week to 52.03% from 49.00% and moved above their 20 day moving average. The Index has returned to an intermediate overbought level.
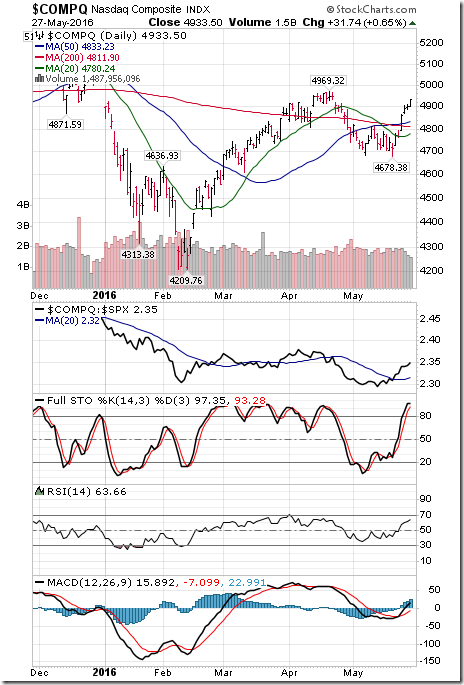
The NASDAQ Composite Index gained another 163.94 points (3.44%) last week. Intermediate trend remains neutral. Strength relative to the S&P 500 Index remained positive last week. The Index remained above its 20 day moving average. Short term momentum indicators continue to trend up. Technical score remained last week at 4.
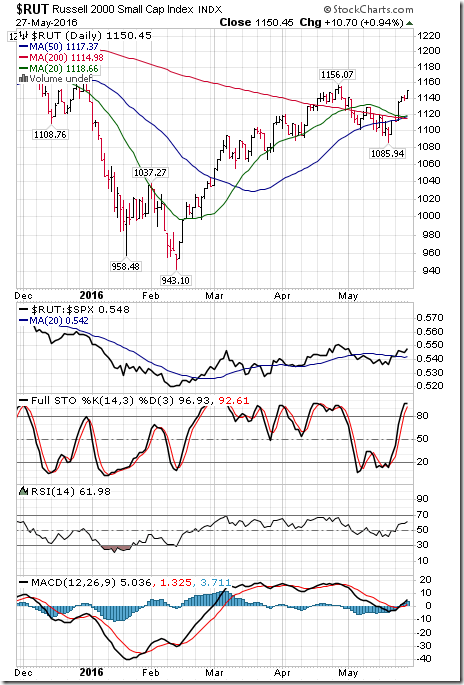
The Russell 2000 Index gained 38.47 points (3.43%) last week. Intermediate trend remained neutral. Strength relative to the S&P 500 Index changed to positive from neutral. The Index moved above its 20 day moving average last week. Short term momentum indicators remain in an uptrend. Technical score improved last week to 4 from -4.
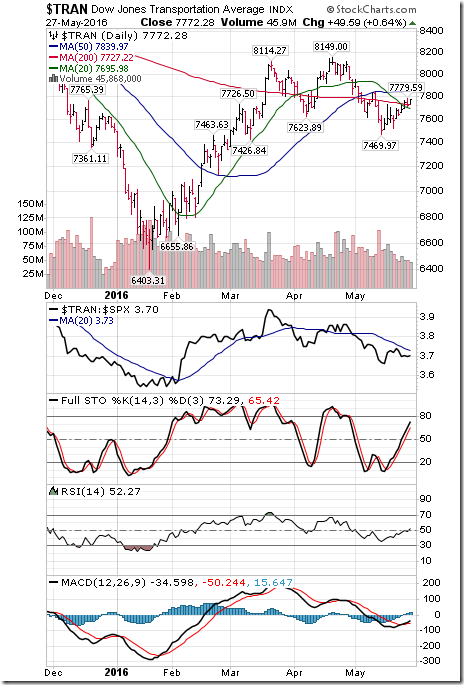
The Dow Jones Transportation Average advanced 50.39 points (0.66%) last week. Intermediate trend remained neutral. Strength relative to the S&P 500 Index remained negative. The Average moved above its 20 day moving average last week. Short term momentum turned higher. Technical score improved last week to 0 from -4.
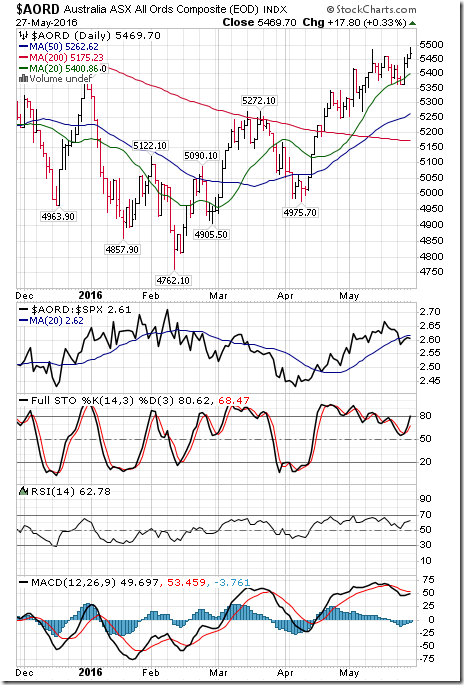
The Australia All Ordinaries Composite Index gained 84.10 points (1.56%) last week. Intermediate trend remained up. Strength relative to the S&P 500 Index changed to neutral from positive. The Index remained above its 20 day moving average. Short term momentum indicators remained mixed. Technical score slipped last week to 3 from 5.
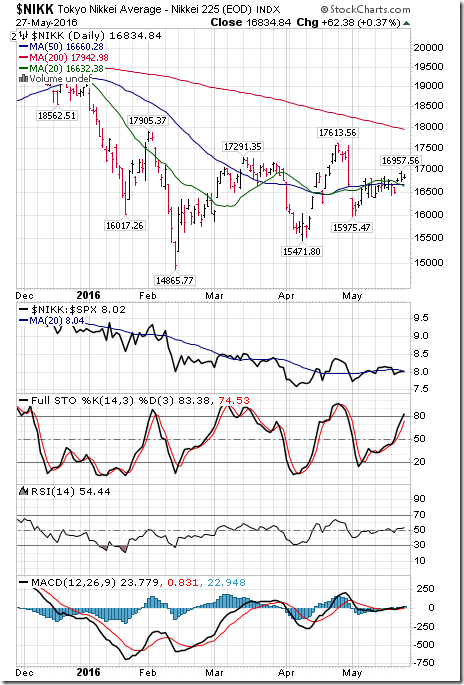
The Nikkei Average gained 188.10 points (1.13%) last week. Intermediate trend remained up. Strength relative to the S&P 500 Index remained neutral. The Average moved above its 20 day moving average last week. Short term momentum indicators are trending up. Technical score improved last week to 4 from 1.
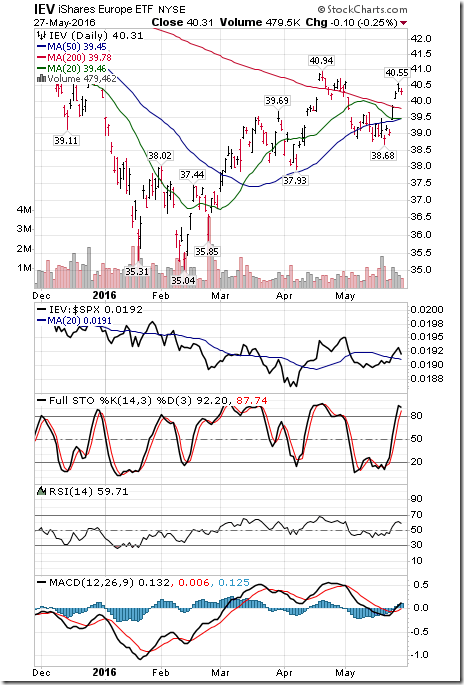
Europe iShares gained $1.15 (2.94%) last week. Intermediate trend remained up. Strength relative to the S&P 500 Index improved to neutral from negative. Units moved above their 20 day moving average. Short term momentum indicators are trending up. Technical score improved to 4 from -1.
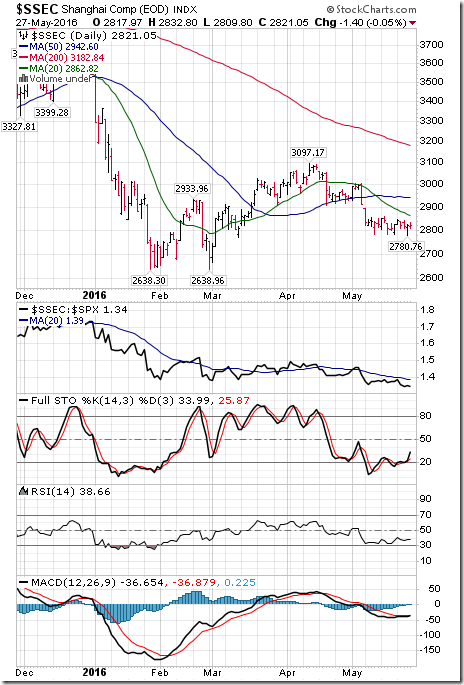
The Shanghai Composite Index slipped 4.43 points (0.16%) last week. Intermediate trend remained up. Strength relative to the S&P 500 Index remained negative. The Index remained below its 20 day moving average last week. Short term momentum indicators have turned up. Technical score improved last week.to 0 from -2.
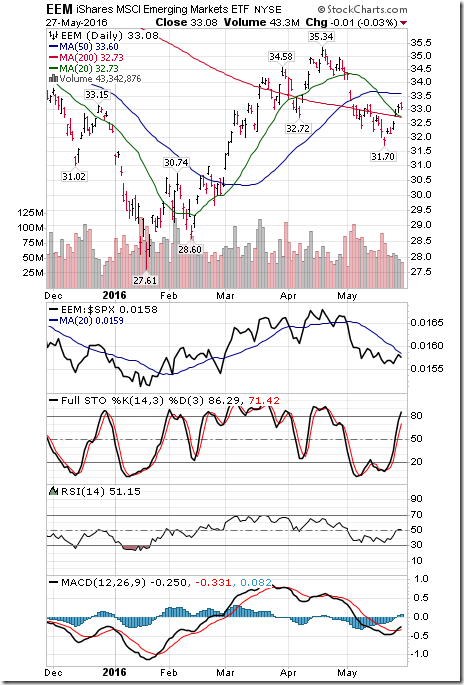
Emerging Markets iShares added $0.87 (2.70%) last week. Intermediate trend remained up. Strength relative to the S&P 500 Index remained negative. Units moved above its 20 day moving average last week. Short term momentum indicators are trending up. Technical score improved last week to 0 from -2.
Currencies
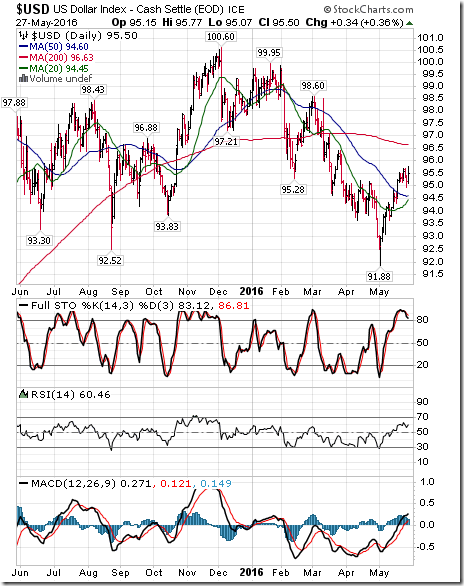
The U.S. Dollar Index added 0.14 (1.47%) last week on growing expectations for an increase in the Fed Fund rate on June 15th. Intermediate trend remained down. The Index remained above its 20 day moving average. Short term momentum indicators are trending up, but are overbought.
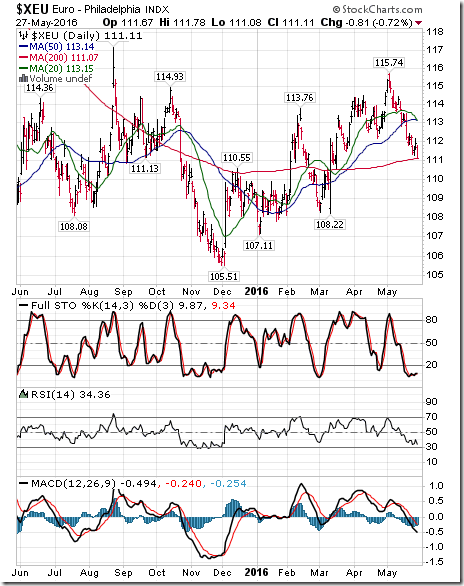
The Euro dropped 1.09 (0.97%) last week. Intermediate trend remained up. The Euro remained below its 20 day moving average. Short term momentum indicators are trending down, but are oversold.
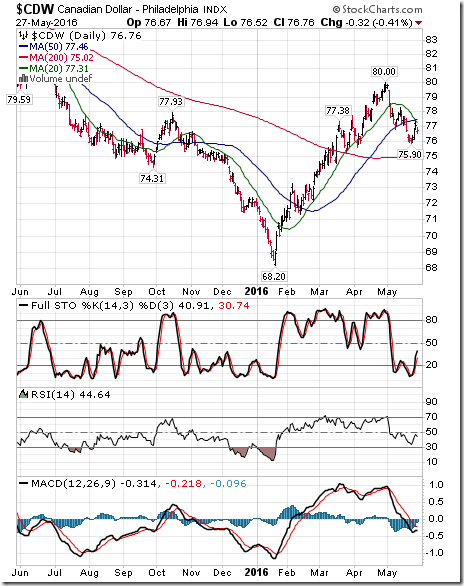
The Canadian Dollar added US 0.55 cents (0.72%) last week. Intermediate trend remained up. The Canuck Buck Index remained below its 20 day moving average. Short term momentum indicators are oversold and showing early signs of bottoming.
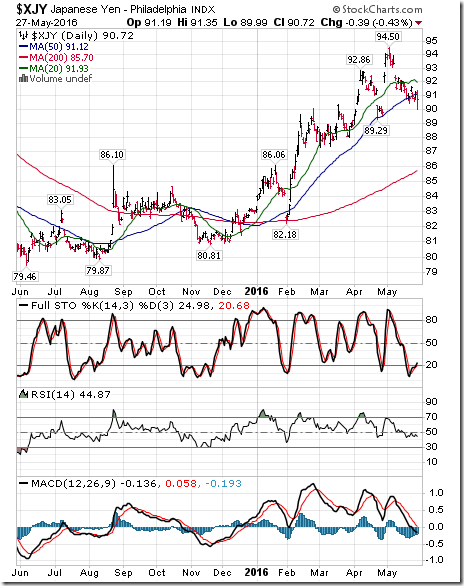
The Japanese Yen slipped 0.08 (0.09%) last week. Intermediate trend remained up. The Yen remained below its 20 day moving average. Short term momentum indicators are trending down, but are oversold.
Commodities
Daily Seasonal/Technical Commodities Trends for May 30th 2016
Green: Increase from previous day
Red: Decrease from previous day
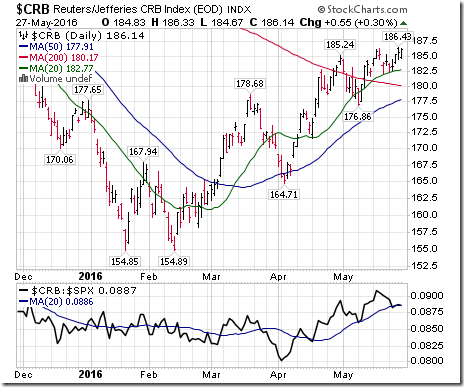
The CRB Index added 2.26 points (1.23%) last week. Intermediate trend remained up. Strength relative to the S&P 500 Index remained positive. The Index remained above its 20 day moving average. Short term momentum indicators remained mixed. Technical score remained last week at 5.
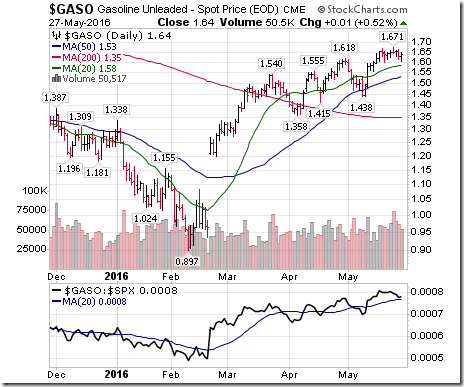
Gasoline was virtually unchanged last week. Intermediate trend remained up. Strength relative to the S&P 500 Index remained positive. Gas remained above its 20 day moving average. Short term momentum indicators are trending up. Technical score remained last week at 6
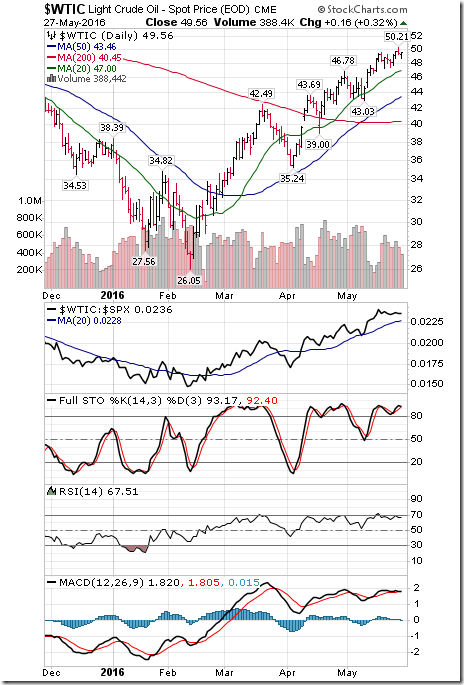
Crude Oil added another $1.15 (2.38%) last week. Intermediate trend remained up. Strength relative to the S&P 500 Index remained positive. Crude remained above its 20 day moving average. Short term momentum indicators continue to trend up. Technical score remained last week at 6.
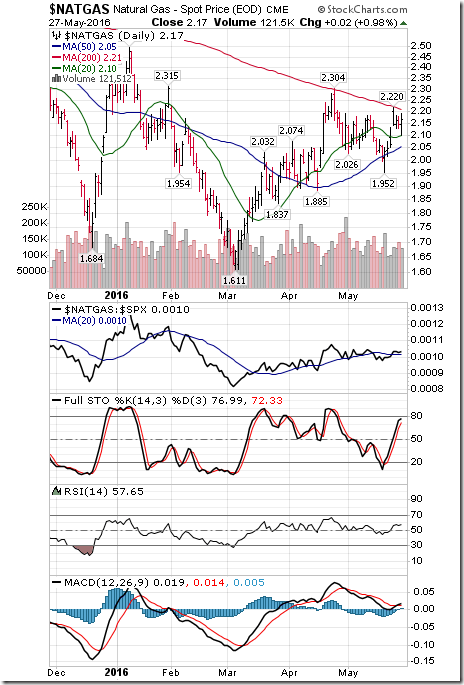
Natural Gas added $0.11 per MBtu (5.34%) last week. Intermediate trend improved to neutral on a move above $2.17. “Natty” moved above its 20 day moving average. Short term momentum indicators are trending up. Technical score improved last week to 2 from -4.
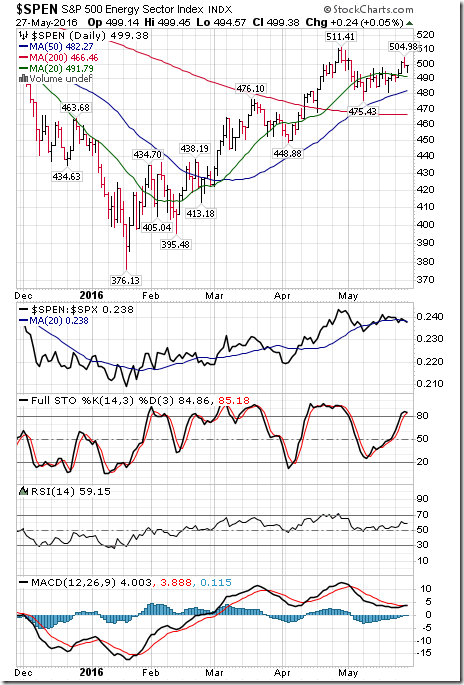
The S&P Energy Index added 6.88 points (1.40%) last week. Intermediate trend remained up. Strength relative to the S&P 500 Index remained neutral. The Index moved above its 20 day moving average. Short term momentum indicators are trending up. Technical score improved last week to 0 from -2
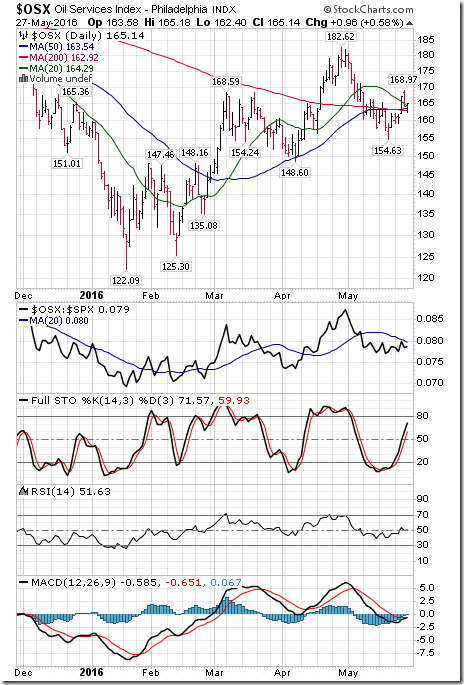
The Philadelphia Oil Services Index gained 3.71 points (2.30%) last week. Intermediate trend remains up. Strength relative to the S&P 500 Index remained negative. The Index moved above its 20 day moving average on Friday. Short term momentum indicators are trending up. Technical score improved last week to 0 from -2
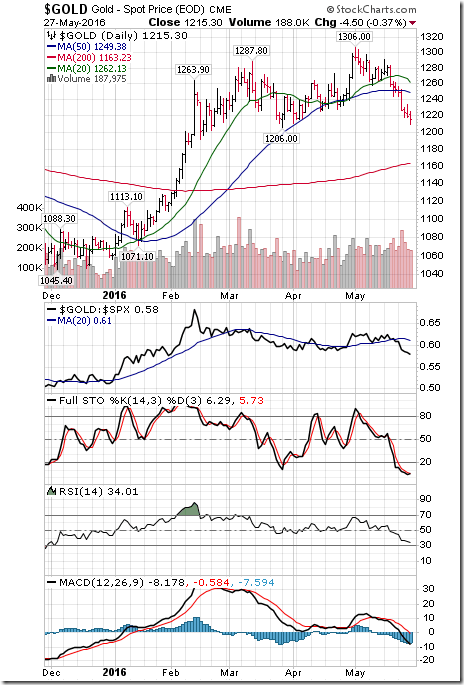
Gold dropped $37.60 per ounce (3.00%) last week. Intermediate trend remained up. Strength relative to the S&P 500 Index changed to negative. Gold remained below its 20 day moving average. Short term momentum indicators are trending down. Technical score slipped last week to -2 from -1
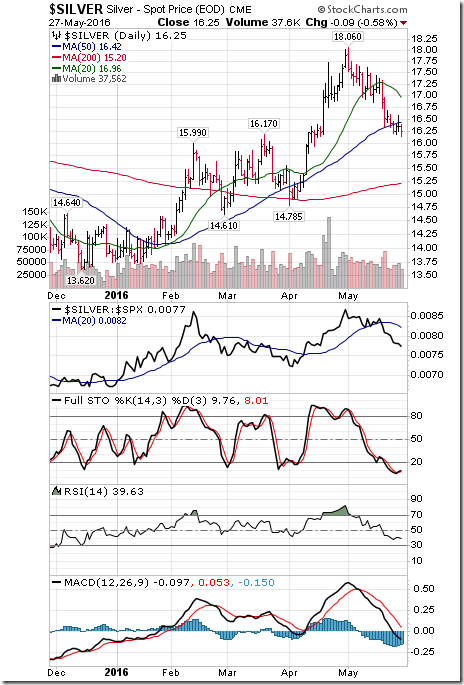
Silver dropped $0.28 per ounce (1.69%) last week. Intermediate trend remained up. Strength relative to the S&P 500 Index remained negative. Silver remained below its 20 day moving average. Short term momentum indicators are trending down. Technical score remained last week at -2
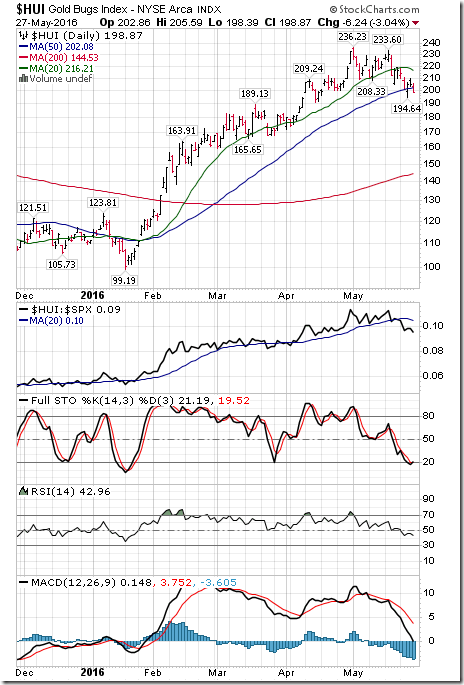
The AMEX Gold Bug Index dropped 17.65 points (8.15%) last week. Intermediate trend remained up. Strength relative to the S&P 500 Index changed to negative. The Index remained below its 20 day moving average. Short term momentum indicators are trending down. Technical score dropped last week to -2 from 2.
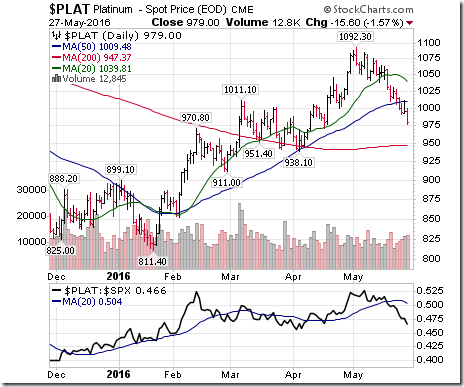
Platinum dropped $44.30 per ounce (4.33%) last week. Intermediate trend remained up. Strength relative to S&P 500 turned negative. Trades below its 20 day MA. Momentum: down.
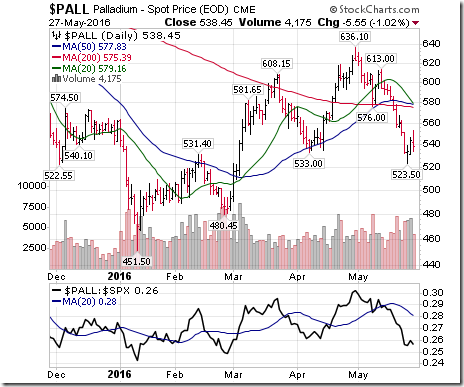
Palladium dropped $20.45 per ounce (3.66%) last week. Trend changed to neutral. Strength relative to the S&P 500 Index remained negative. PALL remained below its 20 day Moving Average. Short term momentum indicators are trending down. Technical score: -4
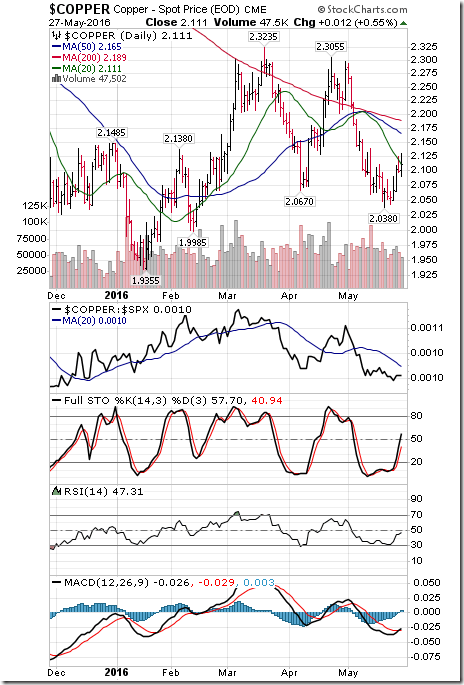
Copper added 0.551 cents per lb. (2.68%) last week. Intermediate trend remained down. Strength relative to the S&P 500 Index remained negative. Copper closed at its 20 day moving average on Friday. Short term momentum indicators have turned upward. Technical score improved last week to -3 from -6.
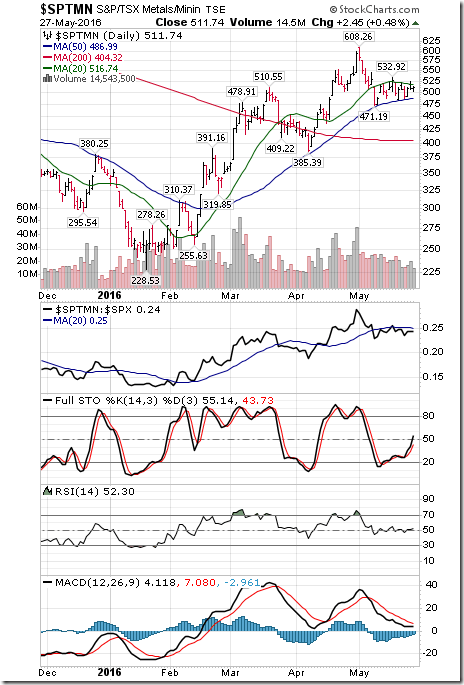
The S&P/TSX Metals & Mining Index added 4.83 points (0.95%) last week. Intermediate trend remained up. Strength relative to the S&P 500 Index remained neutral. The Index remained below its 20 day moving average. Short term momentum indicators are trending up. Technical score improved last week to 0 from 2.
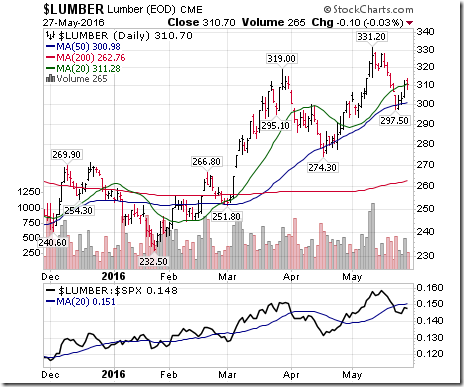
Lumber added $3.40 (1.11%) last week. Trend remained up. Relative strength changed to neutral from positive. Lumber remained below its 20 day MA. Momentum turned positive.
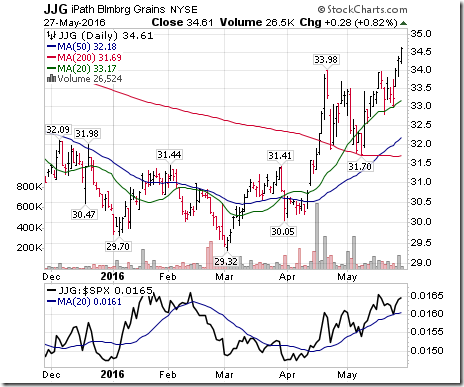
The Grain ETN added $1.11 (3.31%) last week. Uptrend was confirmed on a move above $33.98. Relative strength remained positive. Units remained above their 20 day moving average. Short term momentum indicators are trending up. Technical score remained at 6.
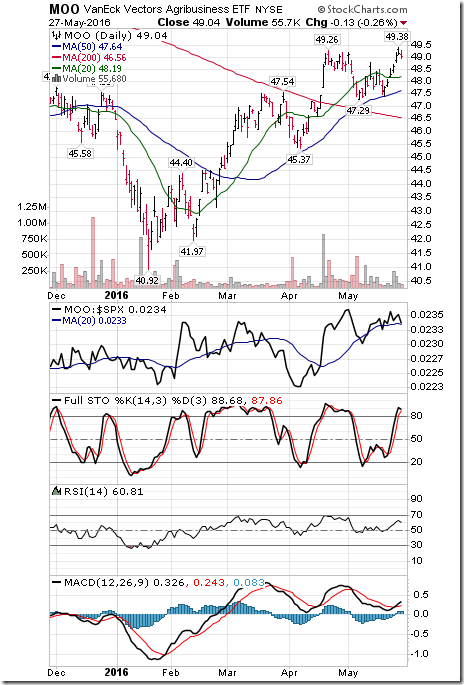
The Agriculture ETF gained $1.09 (2.27%) last week. Intermediate uptrend was confirmed on a move above $49.26. Strength relative to the S&P 500 Index remained positive. Units remained above their 20 day moving average. Short term momentum indicators are trending up. Technical score remained last week at 6.
Interest Rates
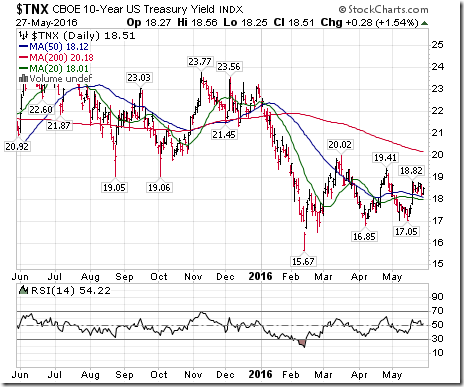
Yield on 10 year Treasuries added 0.2 basis points (0.16%) last week. Intermediate trend remained down. Yield moved above its 20 day moving average. Short term momentum indicators are mixed.
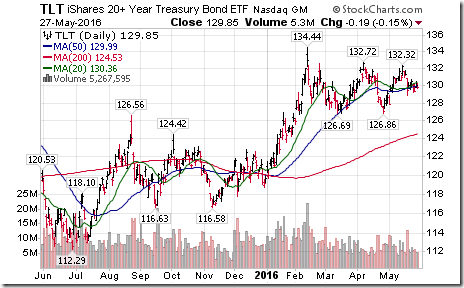
Price of the long term Treasury ETF slipped $0.30 (0.23%) last week. Trend remains up. Units dropped below its 20 day moving average.
Volatility
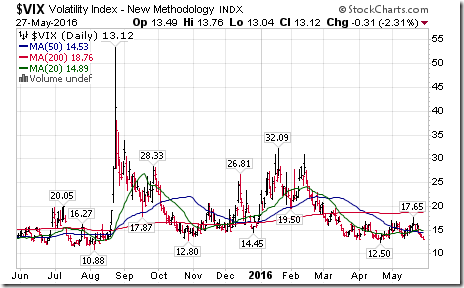
The VIX Index dropped 2.09 (13.74%) last week. Intermediate trend is neutral. The Index dropped below its 20 day moving average.
Daily Seasonal/Technical Sector Trends for May 30th 2016
Green: Increase from previous day
Red: Decrease from previous day
Special Free Services available through www.equityclock.com
Equityclock.com is offering free access to a data base showing seasonal studies on individual stocks and sectors. The data base holds seasonality studies on over 1000 big and moderate cap securities and indices. To login, simply go to http://www.equityclock.com/charts/ Following are examples on charts that were given a lower rating:
Mark Leibovit’s Weekly Radio Broadcast
Following is a link:
WALL STREET RAW RADIO WITH MARK LEIBOVIT – GUESTS: SINCLAIR NOE, JON-MICHAEL NAHON – MAY 28, 2016 http://tinyurl.com/hltdsk3
Keith Richards’ Blog
Gold may underperform for a while:
http://www.valuetrend.ca/gold-may-underperform-for-a-while/
Disclaimer: Seasonality and technical ratings offered in this report by www.timingthemarket.ca and www.equityclock.com are for information only. They should not be considered as advice to purchase or to sell mentioned securities. Data offered in this report is believed to be accurate, but is not guaranteed
Copyright © DV Tech Talk, Timingthemarket.ca


![clip_image002[4] clip_image002[4]](https://advisoranalyst.com/wp-content/uploads/2019/08/833229bf62f9707751b5db71d592344b.png)
![clip_image002[7] clip_image002[7]](https://advisoranalyst.com/wp-content/uploads/2019/08/81d300219df678c9a6b6cb8e874b7e33.png)
![clip_image002[1] clip_image002[1]](https://advisoranalyst.com/wp-content/uploads/2019/08/0fa822fd9eae88f280d66174615c8ac7.png)
![clip_image002[3] clip_image002[3]](https://advisoranalyst.com/wp-content/uploads/2019/08/8a1aef00709368c578d7747989dd13b6.png)
