
Yet Another Disconnect
by John Canally, Chief Economic Strategist, LPL Financial
KEY TAKEAWAYS
· The BLS recently released the Employment Situation for March, which showed mixed results.
· In our view, the April 2016 employment report underscores a key disconnect between the market and Fed.
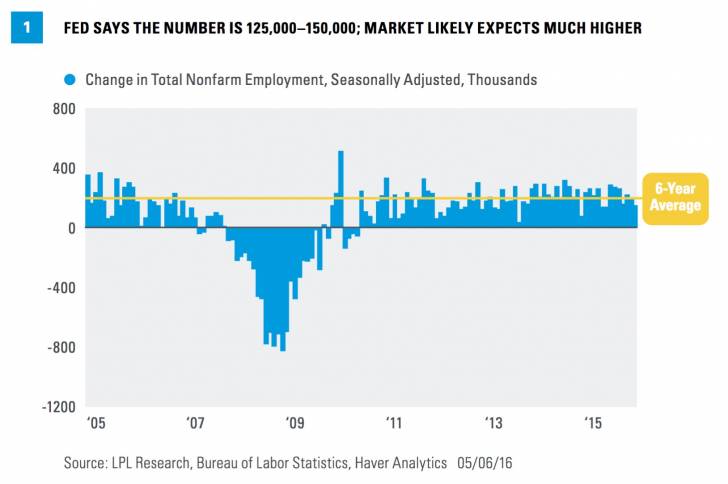
· We believe by the end of 2016, job growth will more routinely be in the 120,000 to 150,000 per month range, a clear deceleration from the average pace over the past six years.
In our view, the April 2016 employment report underscores a key disconnect between the market and Federal Reserve (Fed). What pace of labor market growth is necessary to tighten the labor market, push up wages, and ultimately spark inflation?
This past Friday, May 6, 2016, the Bureau of Labor Statistics (BLS) of the U.S. Department of Labor released its Employment Situation report for April 2016. Each month, the report generates plenty of attention from market participants, the financial media, and of course policymakers at the Fed, and for good reason. The report provides a timely look at the health of the labor market and one side of the Fed’s dual mandate to promote full employment and low and stable inflation; it is also a key driver of consumer spending. The employment report can also help market participants and the Fed make judgments about the amount of slack in the labor market, which, in turn, can provide a window into wage and inflation pressures in the economy, the other half of the Fed’s dual mandate.
MIXED APRIL 2016 EMPLOYMENT REPORT
Relative to market expectations and to recent labor market data, the April 2016 employment report was mixed, at best. The economy added 160,000 jobs in April 2016, well below the consensus estimate of 200,000 jobs, and also well below the 200,000+ jobs per month created, on average, over the past six years (since early 2010), which is when the economy began regularly creating jobs again after the end of the Great Recession [Figure 1].
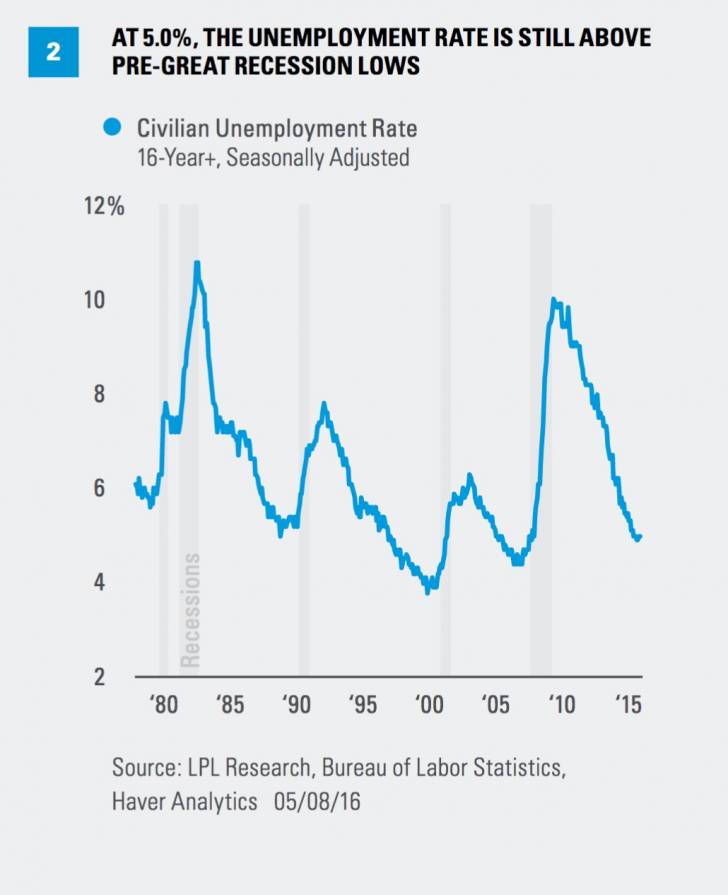
The monthly job count is culled from a survey of nearly 150,000 businesses. At 5.0% in April 2016, the unemployment rate (the number of unemployed as a percentage of the labor force, data culled from a survey of 60,000 households) matched the March reading, but was higher than expected (4.9%) by a consensus of economists as polled by Bloomberg News. Aside from the 4.9% readings in January and February of this year, the unemployment rate is the lowest level since April 2008, but remains above the low prior to the Great Recession, 4.4%, hit several times in 2006 and 2007 [Figure 2].
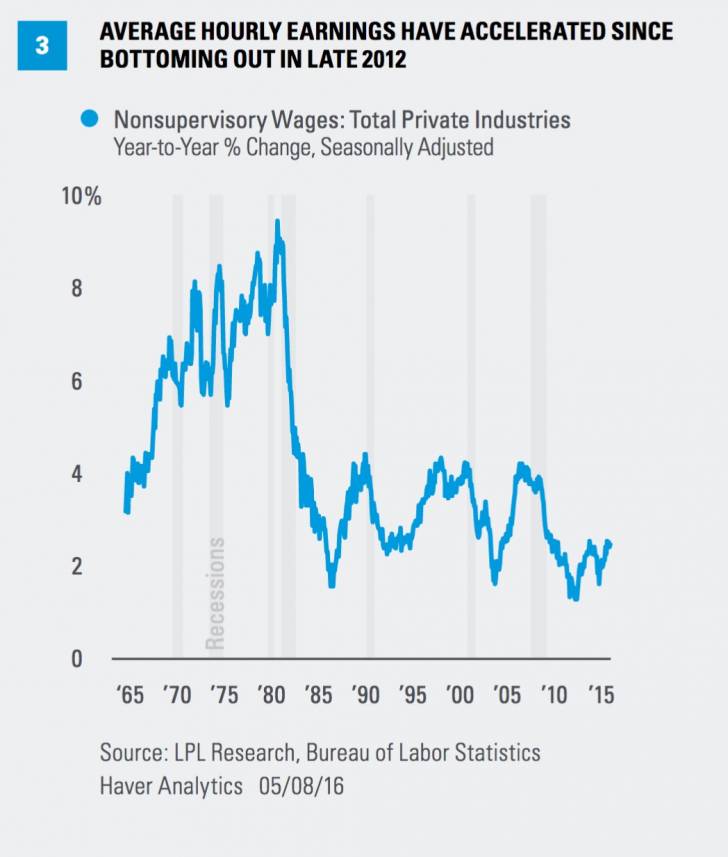
The strongest component of the report—relative to both consensus expectations and recent readings—was the acceleration in wages measured by average hourly earnings, which accelerated to +2.5% year over year in April 2016 from +2.3% in March. The consensus was looking for a more modest acceleration in wages to 2.4% in April. At 2.5%, the pace of wage inflation is the fastest since early 2010, when it was rapidly decelerating from the prerecession high of 4–4.25% hit in 2006 and 2007, down to the low of 1.3% hit in late 2012 [Figure 3]. The deceleration in wages years after the end of the Great Recession is typically what happens after the end of a recession.
One final data point worth noting in the April employment report is the reading on temporary help jobs, which showed just 9,000 new jobs added in April, after a similar gain in March and losses totaling 50,000 in the first two months of 2016. This category of jobs—a key leading indicator of future job growth—has shed 27,000 jobs in the first four months of 2016, the worst performance since mid-2009 when the economy was emerging from the Great Recession. If sustained, the slowdown in temporary help jobs suggests a slowdown in overall jobs creation later this year.
Disconnect in Perspective
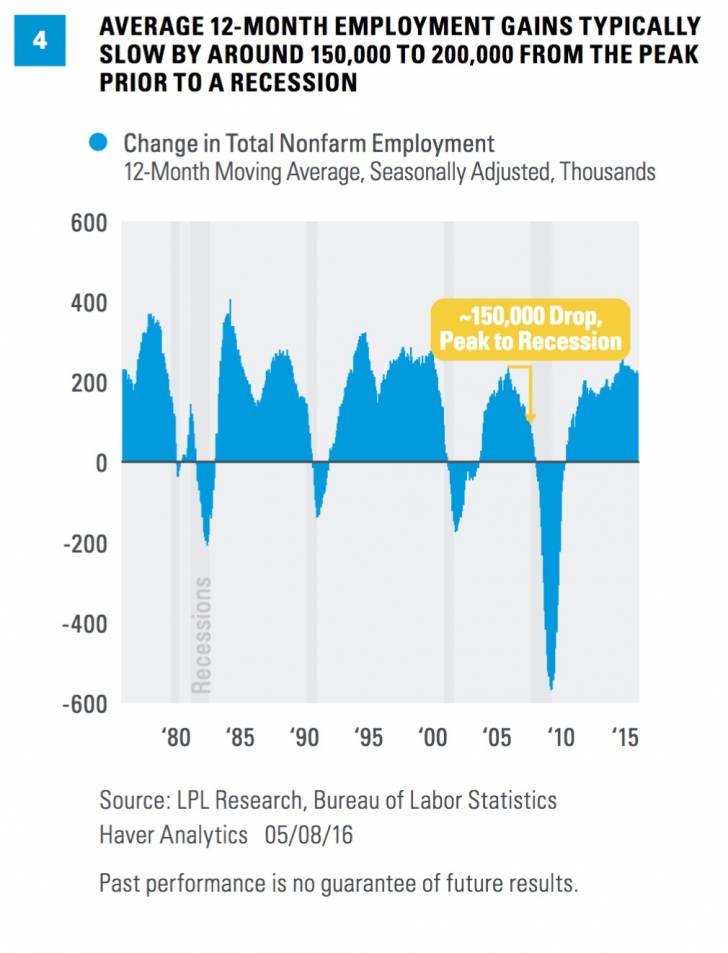
The economy has created an average of 200,000 jobs per month in the past 12 months—despite the tepid reading (+160,000) in April 2016—and there is even a case to be made that the weaker than expected April 2016 reading was “payback” for warmer/drier weather than usual in the first quarter of 2016, which may have artificially boosted job counts in that quarter. In our view, if sustained over the next several months, market participants would likely view this downshift as a sign that the economy is slowing, and may even begin preparing for the next recession and next set of rate cuts from the Fed. Keep in mind that employment is a lagging indicator of the overall economy. In the past 35 years and 5 recessions (1980, 1981–82, 1990–01, 2001, 2007–2009), the average monthly job gain over 12 months typically decelerates by 150,000 to 200,000 jobs before signaling a recession [Figure 4]. Applying that rubric to today suggests that the 12-month average on job creation would have to slow from the current 200,000 to around 25,000 to 50,000 per month to indicate that a recession is underway.
But here’s where the market and the Fed may be at odds. In a series of public appearances over the past few years, Fed officials noted that monthly job gains as low as 120,000 would still be enough to tighten the labor market, take up slack in the economy, and push up wages and ultimately inflation. Whereas the market would likely view a downshift to job creation of 120,000 jobs per month—or even 160,000 per month—as a sign of a slowing economy, and begin to worry about global growth and the onset of recession.
Based on where we are in the business cycle and the recent downshift in temporary help jobs, we believe by the end of 2016, job growth will more routinely be in the 120,000 to 150,000 per month range, a clear deceleration from the 200,000 per month pace seen, on average, over the past six years. At that point, some market participants may be expecting the Fed to ease; but the Fed, all else equal, will likely be tightening. Yet another disconnect between the Fed and the market to worry about.
IMPORTANT DISCLOSURES
The opinions voiced in this material are for general information only and are not intended to provide specific advice or recommendations for any individual. To determine which investment(s) may be appropriate for you, consult your financial advisor prior to investing. All performance referenced is historical and is no guarantee of future results. All indexes are unmanaged and cannot be invested into directly.
The economic forecasts set forth in the presentation may not develop as predicted.
The monthly jobs report (known as the employment situation report) is a set of labor market indicators based on two separate surveys distributed in one monthly report by the U.S. Bureau of Labor Statistics (BLS). The report includes the unemployment rate, non-farm payroll employment, the average number of hours per week worked in the non-farm sector, and the average basic hourly rate for major industries.
Copyright © LPL Financial