


Appetite for Long Term Bonds Continues Growing
In this week’s edition of the Equity Leaders Weekly, we are going to give an update on interest rates in the U.S. through the CBOE 30-yr Interest Rate (TYX.I) and then take a look at the relationship between long and intermediate-term US treasury bonds through a comparison chart of the iShares 20+ year Treasury Bond ETF (TLT) and the iShares 3-7 year Treasury Bond ETF (IEI).
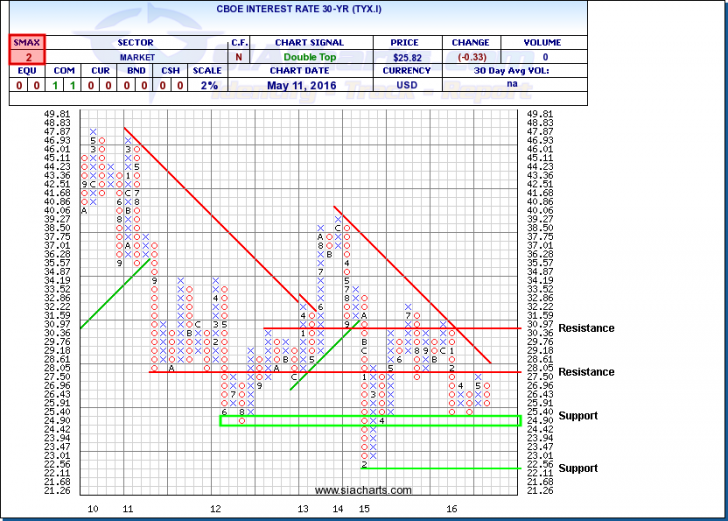
CBOE Interest Rate 30-yr (TYX.I)
We last looked at Treasury yields back on January 27th, 2016. After falling through the 2.75% level, TYX.I has moved between 2.75% and 2.5%, closing at 2.58% Wednesday evening. In looking at the TYX.I chart we can see that it was unable to make it through resistance at 2.805% and has since turned back and is approaching strong support around 2.5%. It looks as though for the time being interest rates may be range bound between these levels until there is some other activity which may move it out of these bounds.
To nobody’s surprise, the Federal Reserve chose to leave interest rates in their April meeting, however some analysts said that the tone was less dovish than in previous meetings and that a rate increase in the June is not off the table. The Fed’s decision making process includes analysis of many factors including domestic and international growth, commodity price strength, inflation numbers, labor market numbers as well as consumer spending to name a few. In the near term some important data points that the Fed will be noting are retails sales numbers which come out this Friday and April CPI numbers which will come out next Tuesday.
Click on Image to Enlarge
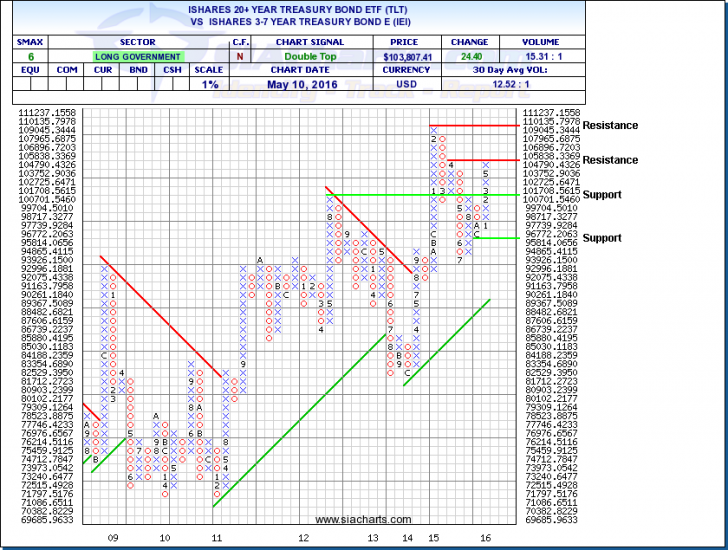
iShares 20+ yr Treasury Bond ETF (TLT) vs. iShares 3-7 yr Treasury Bond ETF (IEI)
Next we will look at a comparison chart for the iShares 20+ yr Treasury Bond ETF (TLT) vs. iShares 3-7 yr Treasury Bond ETF (IEI). This comparison chart can give us some insight into the markets appetite for risk in fixed income securities as longer maturities generally have higher risk – and thus, higher coupon payments. This relationship can also give us some insight into whether or not the market is discounting any potential Fed action regarding interest rates. Since the price of longer term fixed income securities are more sensitive to changes in interest rates, money flows from long-term to intermediate and short-term fixed income securities can be a leading indicator that the market is starting to prepare for Federal Reserve action and do not want to have as much price exposure to interest rates.
In looking at the chart we can see that in 2014 there was relative out performance of TLT over IEI however that trend reversed for most of 2015 where we saw shorter term bonds out perform. This coincides with interest rates increasing throughout 2015. In the more recent term we have again seen a reversal to longer-term bonds as the threat of Fed interest rate increases subsided through their dovish tones. It will be important to monitor key economic data as well as what the Fed is communicating to when the next interest rate increase may come but also the relationship between shorter and longer term bonds can provide some insight into what the market is thinking.
***Disclosure: TLT is a security that is presently held within certain portfolios managed by SIA Wealth Management Inc.
Click on Image to Enlarge
SIACharts.com specifically represents that it does not give investment advice or advocate the purchase or sale of any security or investment. None of the information contained in this website or document constitutes an offer to sell or the solicitation of an offer to buy any security or other investment or an offer to provide investment services of any kind. Neither SIACharts.com (FundCharts Inc.) nor its third party content providers shall be liable for any errors, inaccuracies or delays in content, or for any actions taken in reliance thereon.
For a more in-depth analysis on the relative strength of the equity markets, real estate, bonds, commodities, currencies, etc. or for more information on SIACharts.com, you can contact our customer support at 1-877-668-1332 or siateam@siacharts.com.
Copyright © SIACharts.com