by Don Vialoux, Timingthemarket.ca
Daily Observations
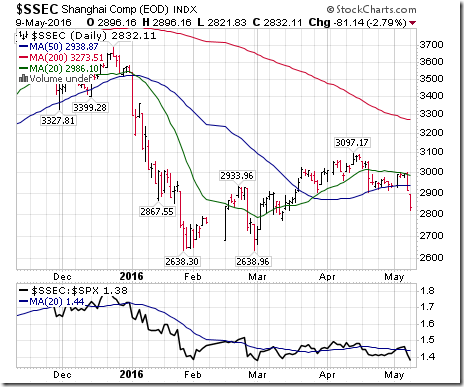
Concerns about a slowdown by China’s economy had a significant impact on equity and commodity markets yesterday:
The Shanghai Composite moved below a short term trading range and began to show negative performance relative to the S&P 500 Index.
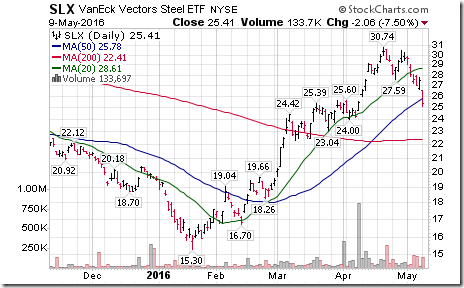
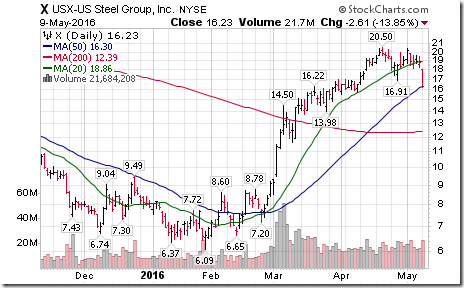
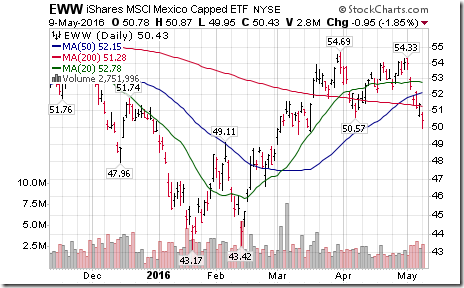
Weakness in the Shanghai Composite Index quickly spread to China sensitive markets and sectors including the TSX Composite, the Mexico ETF, base metals, steel, materials, industrials and energy. See StockTwits comments below for additional comments and charts.
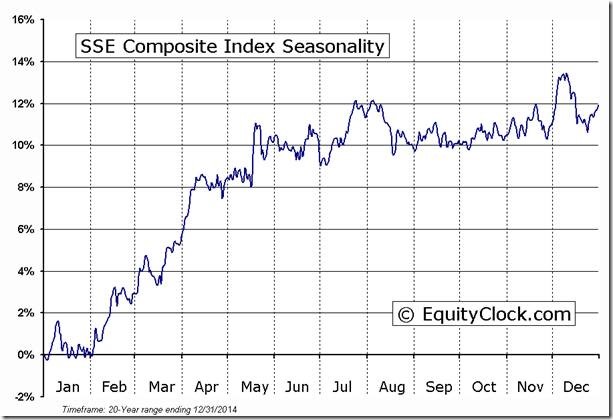
Typically, the Shanghai Composite Index reaches a seasonal peak in mid-May. This year, the seasonal peak came three weeks earlier than average
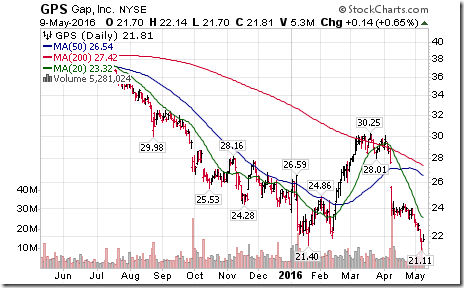
A “heads up” on Gap Stores (GPS)! It reported significantly lower than consensus first quarter results after the close yesterday. The stock traded at $19.35, significantly lower than previous support near $21.40. Look for the Retail ETF (XRT) and other related merchandisers to come under pressure at the opening (Several large retailers are scheduled to report later this week).
StockTwits Released Yesterday
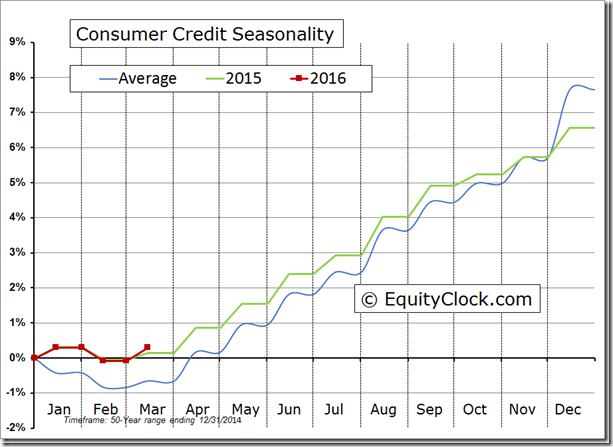
Consumer credit just realize the largest monthly increase since December 2010
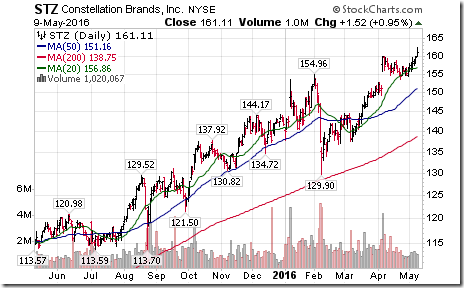
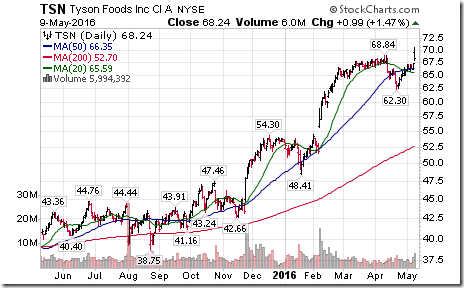
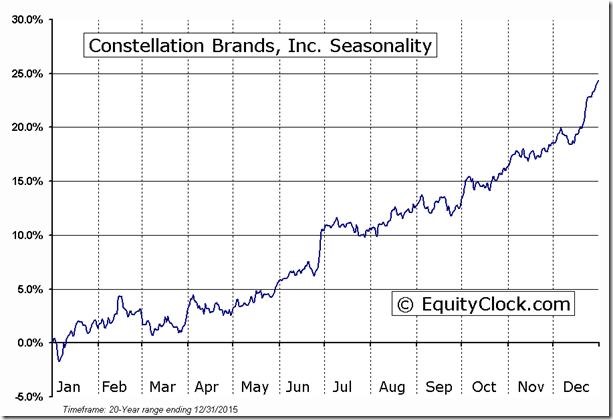
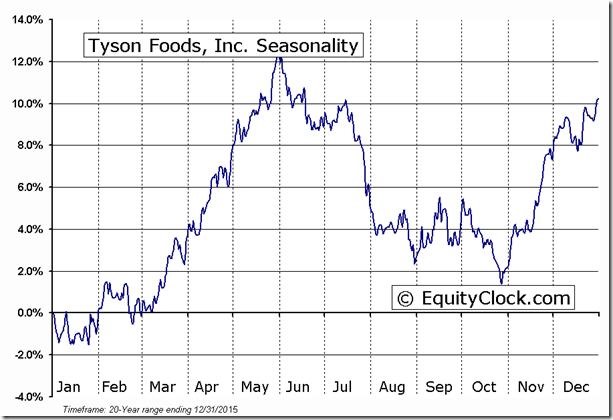
Technicals for S&P 500 stocks to 10:15: Bullish. Breakouts: $STZ, $TSN, $AMT, $CTAS, $ACN, $EMC, $FISV, $CCI. Breakdowns: $MPC, $NBR
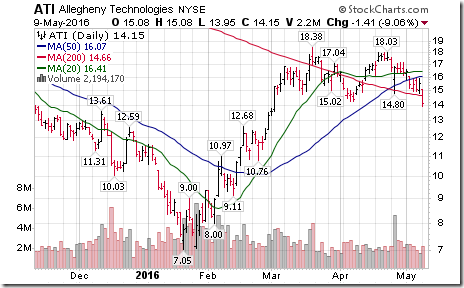
Editor’s Notes: Note seasonality charts on $STZ and $TSN indicated below. After 10:15 AM EDT, technical action by S&P 500 stocks was mixed: Breakouts: $MAC, $GGP. Breakdowns: $ATI, $NE.
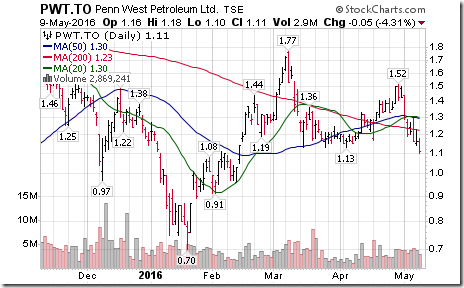
Canadian “oily” stocks continue to respond to the Fort McMurray disaster. $ PWT. CA broke support at $1.13
U.S. Steel stocks are responding to China weakness $ATI completed a double top pattern. $X, $SLX, down more than 10%.
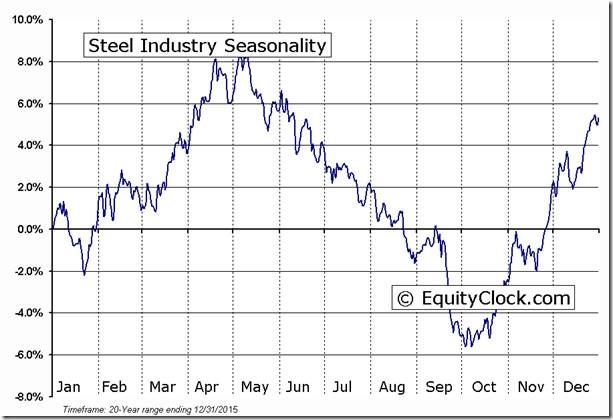
‘Tis the season for weakness in U.S. Steel stocks! $NUE, $X, $ATI, $SLX
Mexico iShares $EWW broke support at $50.57 to establish a new intermediate downtrend.
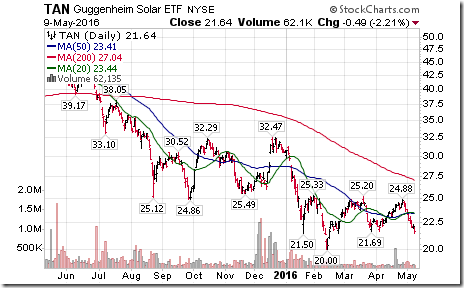
Investor confidence in Solar stocks and related ETFs continues to deteriorate. $TAN broke support at $21.69.
Editor’s Note: After the close, Solar City (SCTY) reported less than consensus quarterly results. The stock plunged over 20%. Look for TAN to test support at $20.00.
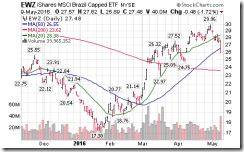
The Brazil iShares has started to crack on the charts prior to possible impeachment of the country’s President on Wednesday.
Trader’s Corner
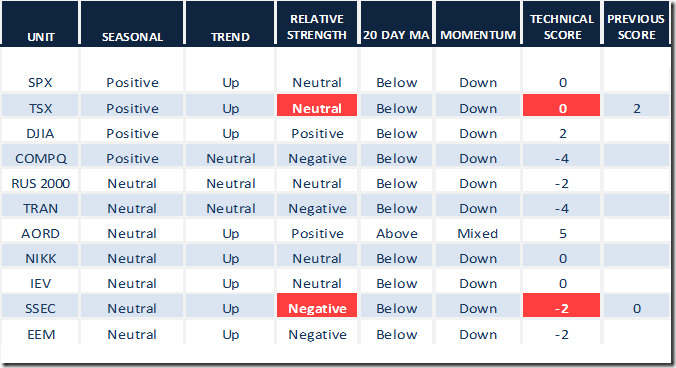
Daily Seasonal/Technical Equity Trends for May 9th 2016
Green: Increase from previous day
Red: Decrease from previous day
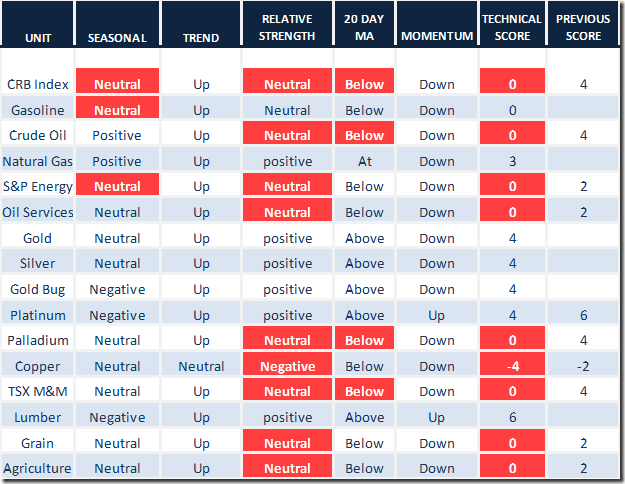
Note significant deterioration by commodities/investments related to economic weakness in China. Also note the change in seasonal influences.
Daily Seasonal/Technical Commodities Trends for May 9th 2016
Green: Increase from previous day
Red: Decrease from previous day
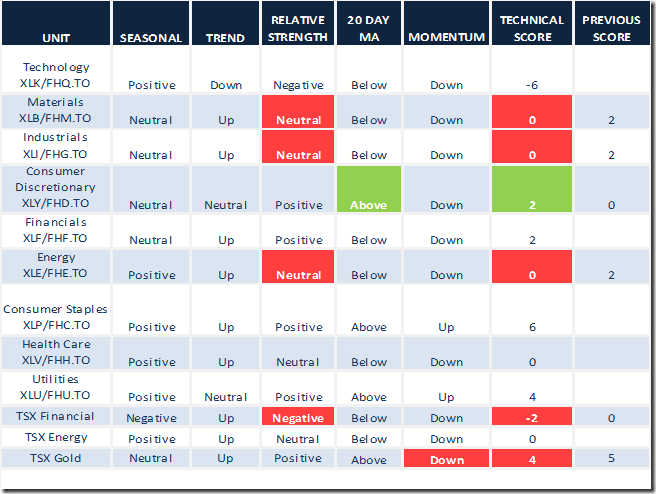
Daily Seasonal/Technical Sector Trends for March May 9th 2016
Green: Increase from previous day
Red: Decrease from previous day
Special Free Services available through www.equityclock.com
Equityclock.com is offering free access to a data base showing seasonal studies on individual stocks and sectors. The data base holds seasonality studies on over 1000 big and moderate cap securities and indices. To login, simply go to http://www.equityclock.com/charts/ Following are examples (both broke intermediate resistance levels yesterday):
Mark Leibovit’s Comments on Cement Stocks
Trumps says he will build a wall between Mexico and the U.S. Cement stocks are responding?
Following is Mark’s comments and a link:
The material/cement shares have been soaring in recent weeks tied to the growing likelihood that a wall will be built along the Mexican/US border. A project of this size and scope would indeed help ‘America Become Great Again’ creating untold amount of jobs and business for U.S. construction and material companies. The video displays weekly charts for MLM, VMC, and CX and demonstrates how the Leibovit Volume Reversal helped confirm the recent advance.
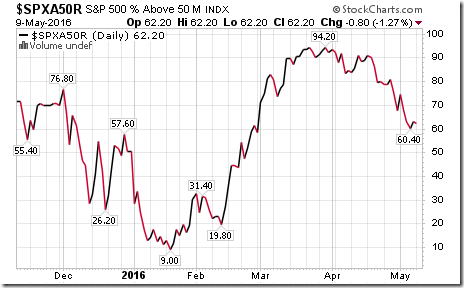
S&P 500 Momentum Barometer
The Barometer slipped 0.80 to 62.20 yesterday. It remains intermediate overbought and trending down.
The TSX Composite Momentum Barometer
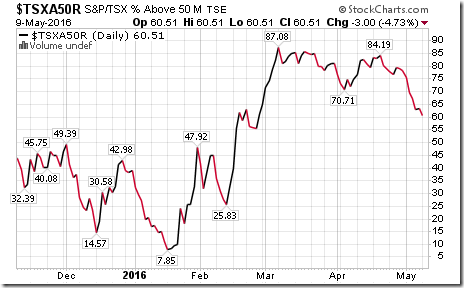
The Barometer continued to move lower yesterday, down another 3.00 to 60.51. The Barometer remains intermediate overbought and trending down.
Disclaimer: Seasonality and technical ratings offered in this report by www.timingthemarket.ca and www.equityclock.com are for information only. They should not be considered as advice to purchase or to sell mentioned securities. Data offered in this report is believed to be accurate, but is not guaranteed
Copyright © DV Tech Talk, Timingthemarket.ca


