
Two New York Advance-Decline Lines, Two Different Signals
by John Murphy, Stockcharts.com
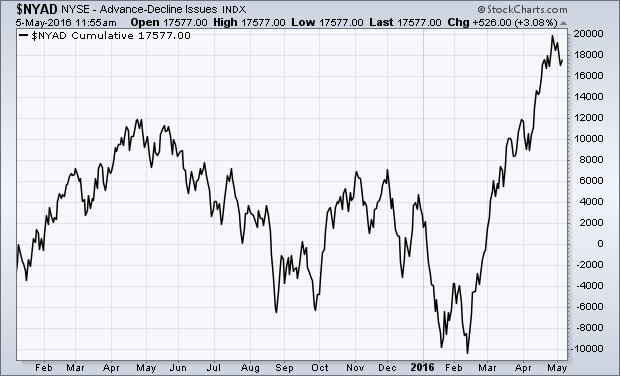
THE TRADITIONAL NYAD LINE HITS NEW RECORD... Chartists look to the NYSE Advance-Decline line to help determine the trend of the stock market. The NYAD line is simply a running cumulative total of the number of advancing stocks minus decliners on the big board. And it has a good track record of leading turns in the stock market itself. Chart 1 shows the traditional version of the NYAD line peaking last May which warned of a market downturn that started last summer and lasted into this year. Chart 1 also shows the advance-decline hitting a record high this spring. That's a very positive sign for the stock market. Not all chartists agree, however, that the line in Chart 1 truly represents the market. That's because it includes a number of issues that aren't true common stocks -- like preferred stocks and entities more closely tied to the bond market. Those chartists believe that a correct version of the advance-decline should include only common stocks.
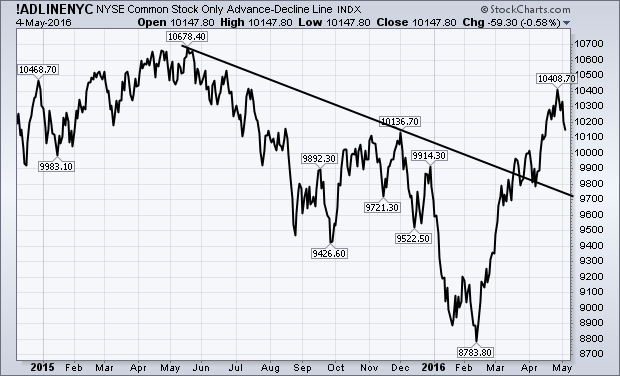
NYSE COMMON STOCK ONLY AD LINE ISN'T AS STRONG... Chart 2 shows the NYSE Common Stock Only (CSO) Advance-Decline line. As the name implies, this version of the AD line includes only common stocks. That version of the line also peaked last May and bottomed during February. It has since then exceeded its fourth quarter high and reached the highest level since last July. What the AD line hasn't done is move above last May's peak to a new record. So it doesn't look as impressive as the more traditional version in Chart 1. Although its intermediate trend is clearly higher, the fact that it hasn't hit a new record leaves in some doubt the issue of whether stock indexes will reach new highs. Historically, however, it should be pointed out that this version of the advance-decline usually lags behind the more traditional version.
 - John
StockCharts members: Click here to see the rest of John's AD comments.