
Are Three-Year Track Records Meaningful?
by Corey Hoffstein, Newfound Research
Summary
- Many asset management decisions are based on the three-year track record.
- Three-years is suspiciously close to a common rule-of-thumb for calculating statistics, but in this case, it is a misapplication.
- With many strategies, short-term luck swamps long-term skill.
- Combining strategies can reduce the risk of making investment decisions based on results driven by luck. This makes it easier to maintain a disciplined focus on skill.
In the asset management industry, there is a magic number: 3 years.
This comes up in many ways. Many advisors will only allocate to strategies with live, 3-year track records. Some platforms will only consider you for shelf space when you have a 3-year track record. Many mutual fund screens require a 3-year track record.
What gives?
Our suspicion has long been that the choice of 3 years is tied to the law of large numbers in statistics. The law of large numbers states that with a sufficiently large sample, we can estimate the true underlying mean of the distribution.
For example, it is easy to quickly google the average height of an adult male. Not only can we find the average height, but we get statistics around how common or rare it is to be in a certain height range.
Last we checked, no research group ever came around and took our measurements. So why are these figures published with such certainty?
The answer is the law of large numbers and assuming that heights are normally distributed. By looking at what is called a representative sub-sample of the overall population, researchers and scientists can learn about the population as a whole.
When it comes to sub-sampling, the number 30 holds a strange mystique. 30 samples is often considered the minimum threshold needed to rely on a normal distribution for statistical calculations, assuming that the data points are not too skewed. So measure the height of 30 random adult men and the distribution will likely be able to make statements about the true distribution of adult male heights.
Of course, sampling more is always helpful, but the marginal benefit declines fairly rapidly after 30 in the case of normally (or close to it) distributed variables.
So what does this have to do with 3-year track records? Well, if a manager is trying to createalpha, then waiting 3 years gives us 36 monthly samples to measure the mean and standard deviation of that alpha[1], which is generally assumed to be normally distributed. According to the law of large numbers, this should allow us to put some statistical significance behind the manager’s skill.
Unfortunately, reality is not quite this simple.
Let’s pretend for a moment that we are introduced to 5 new managers and we track their relative performance over the next 36 months.
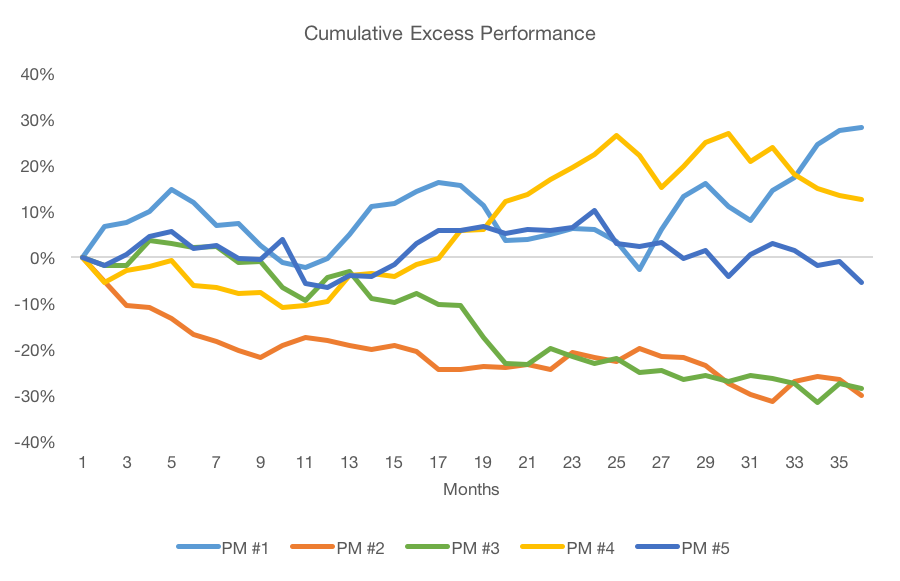
At the end of 3 years, we have what appear to be clear winners and clear losers. Manager #1 has added 28% on top of his benchmark while Managers #2 and #3 have underperformed by 29%. Good thing we waited to see who really had skill, right?
Yet in our contrived example, we gave each manager the identical mean and standard deviation properties for their alpha. Each had an identical expected alpha of 2.8% and a volatility around that expectation of 11.5% (numbers derived from the long-term expected alpha of a value strategy).
If we correctly interpreted the application of having at least thirty samples, statistics[2] tells us that we would expect (with 95% confidence) these managers to have returns between -31.4% and 48.2% relative to the benchmark. All managers fall within that range.
Relying on a three year track record becomes even more dubious when the returns of the strategy are more skewed, as is the case with many tactical strategies that seek to provide an asymmetric return profile.
An easy way to think about this is that the expected alpha is long-term skill. The volatility – both positive and negative – is short-term luck. These two numbers are combined to create theinformation ratio (“IR”) by dividing the skill by the short-term luck.
In statistics, the rule is that the skill component should grow linearly with time. The luck component should only grow with the square-root of time. So over the long run, the skill component should dominate. But how long is the long run?
Assuming our alpha is normally distributed, we could be 95% confident that our realized alpha would be positive after holding for n years where,

With value’s IR of 0.24 (2.8% / 11.5%), we’d have to plan to hold a value strategy for 68 years to be 95% confident the alpha we realize would be positive at the end of the day.
It is worth pointing out here that similar math holds for asset classes as well, where we can just replace the information ratio with the Sharpe ratio. So if stocks have a long-term expected excess return of 6% and a volatility of 12%, the Sharpe ratio is 0.5. This means we’d have to hold them for 16 years to be 95% confident that our realized excess return is positive.
The holding period is even longer if we want to be confident that our alpha or realized excess return is closer to the expected value rather than just being positive. After all, that is what many investors expect if it is called the “expected return”. The reality of making investment decisions often trumps the law of large numbers before the latter has had enough time to show its value.
Much like our last commentary about how good strategies must sometimes underperform and bad strategies must sometimes outperform, this is another frustrating reality of asset management: in the short run, luck swamps skill.
Worse, for “thin” alphas – those with low information ratios – luck can dominate skill even in the long run. We can see this by calculating n for different alpha sources, where n is the number of years we would have to wait to be 95% confident that we actually generate positive realized alpha.
| Excess Return | Volatility | Information Ratio | “n” | |
| Quality | 3.90% | 7.90% | 0.49 | 16.4 years |
| Size | 1.70% | 9.30% | 0.18 | 119.7 years |
| Value | 2.80% | 11.50% | 0.24 | 67.5 years |
| Momentum | 8.20% | 14.60% | 0.56 | 12.7 years |
| Beta | 10.30% | 11.00% | 0.94 | 4.6 years |
Source: Data from AQR and Yahoo! Finance. Calculations by Newfound Research. Data from July 1957 to November 2015. Factor returns reflect self-funding long/short indices. Returns are excess returns (net of risk-free rate) and include the reinvestment of dividends. Hypothetical returns do not reflect fees or expenses. Data does not reflect any Newfound index or strategy. Past performance does not guarantee future results.
The good news is that we can take advantage of luck by exposing ourselves to several diversified sources of it.
| Excess Return | Volatility | Information Ratio | “n” | |
| Avg. of 5 Factors | 5.90% | 4.00% | 1.48 | 1.8 |
Source: Data from AQR and Yahoo! Finance. Calculations by Newfound Research. Data from July 1957 to November 2015. Factor returns reflect self-funding long/short indices. Returns are excess returns (net of risk-free rate) and include the reinvestment of dividends. Hypothetical returns do not reflect fees or expenses. Data does not reflect any Newfound index or strategy. Past performance does not guarantee future results.
Our key takeaways:
- Luck – both positive and negative – will dominate skill in the short-run for most alpha sources. It may even dominate skill in the long-run for thinner alpha sources (e.g. size and value).
- Short-term returns may actually be a downright misleading measure of manager skill.
- Looking at short-term results to identify whether something “is or is not working” is likely a futile exercise. Quarterly or annual reviews of manager performance may actually lead us to over or under estimate skill based on recent luck.
- Maintaining long-term exposure to several unique sources of alpha can help good luck cancel out bad luck and expose the underlying skill. In this framework, we want to review portfolio performance on a holistic basis.
- Manager-by-manager performance reviews should be accompanied by an understanding of the alpha source they are pursuing and the volatility to expect from that alpha source.