by Don Vialoux, Timingthemarket.ca
Stock Market Outlook for April 1, 2016

Over the past 50 years, the S&P 500 Index has closed higher in April 70% of the time, averaging a gain of 1.5%.
**NEW** As part of the ongoing process to offer new and up-to-date information regarding seasonal and technical investing, we are adding a section to the daily reports that details the stocks that are entering their period of seasonal strength, based on average historical start dates. Stocks highlighted are for information purposes only and should not be considered as advice to purchase or to sell mentioned securities. As always, the use of technical and fundamental analysis is encouraged in order to fine tune entry and exit points to average seasonal trends.
Stocks Entering Period of Seasonal Strength Today:
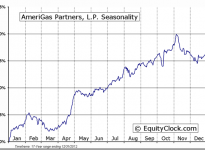
AmeriGas Partners, L.P. (NYSE:APU) Seasonal Chart
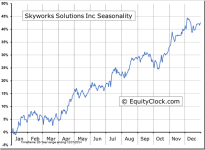
Skyworks Solutions Inc (NASDAQ:SWKS) Seasonal Chart
The Markets
Stocks closed marginally lower on Thursday as investors placed their final trades before the end of the quarter. The S&P 500 Index shed two-tenths of one percent, maintaining support at the gap that was opened in Wednesday’s session. For the month, the large-cap benchmark is higher by 6.60%, the best March return since 2009. The average gain for this third month of the year is 1.1%, based on data from the past 50 years. Gains were led by the energy and technology sectors, which according to the S&P 500 sector benchmarks returned just over 9% each; laggard was the health care sector, which returned a mere 2.59%, remaining under pressure as a result of the strain in the biotech industry. The energy sector remains in a period of seasonal strength, which began in January, through to May, while Technology enters its next seasonal up-leg in April, leading up to the developer conferences through the spring months. Meanwhile, as noted in yesterday’s report, the beleaguered health care sector enters its period of seasonal strength at the end of April.

ENERGY Relative to the S&P 500


TECHNOLOGY Relative to the S&P 500


After a strong month of March, there may be reason to expect another solid return in April. Over the past 50 years, the S&P 500 Index has realized a gain in 70% of Aprils, averaging a return of 1.5%. The average gain and the frequency of success is the strongest of the year. That being said, one must wonder that given the stellar return recorded in March, will results for April be altered as stocks become exhausted. Since 1950, there have been 6 instances where March has recorded a gain greater than 5%. The strong result in March was followed by an average return in April of 1.1%, which was heavily skewed by the 9.4% return recorded in April 2009 following the sizable loss realized in the first quarter. This highlights a fairly important point. April 2009 was coming off of a substantial low in equity prices in the month that preceded it, allowing for the continuation of gains. Along with the return of 8.5% in March of 2009, there has been only one other March in the past 50 years that has seen a gain greater than 6%, similar to this year. March of 2000 saw a return of 9.7%; the month that followed saw a give-back of 3.1% as the benchmark began a substantial topping process. So while one instance followed a significant bottoming pattern, which allowed for the continuation of gains through the spring, the other was part of a significant topping pattern, leading to declines for the remainder of the year. So the question you must ask yourself, are we coming out of a significant long-term bottoming pattern or do we remain in a significant long-term topping pattern? Let the debate begin!


Typically, the best sectors in the month of April, based on performance over the past 20 years, are Energy and Materials, both averaging returns for the month of over 3%. From a frequency perspective, Energy, Materials, Consumer Discretionary, Technology, and Utilities have all recorded gains for the month at least 70% of the time. Health care and Consumer Staples saw the weakest average performance and gain frequency as investors shy away from the defensive assets.

MATERIALS Relative to the S&P 500


HEALTHCARE Relative to the S&P 500


On the economic front, Thursday’s report on jobless claims did present some concern on the surface, but, stripping out adjustments, shows that the beneficial trend remains intact. Initial jobless claims rose 4.2% to 276,000 last week, just above the consensus range that topped out at 275,000. Without adjustments, initial claims rose by 2.1%, slightly elevating the year-to-date change to –31.9%. The average year-to-date change for this time of year is –38.0%. Continuing claims continued to decline, falling 3.3% and resulting in a year-to-date change of –3.7%. Continued claims have averaged a change of 0.1% through the middle of March over the past 47 years. Overall, the trends for both initial and continued claims remain favourable, pushing lower into the spring, following seasonal norms. The below average trend in continued claims suggests a healthy jobs market, a fact that should be reflected in Friday’s Non-Farm payroll report.


Sentiment on Thursday, as gauged by the put-call ratio, ended bearish at 1.15.

Seasonal charts of companies reporting earnings today:

S&P 500 Index


TSE Composite