SIA Weekly: A Look at the S&P500, Relative to Bonds and Commodities
For this week’s edition of the SIA Equity Leaders Weekly, we are going to examine the U.S. Equity Asset Class now that the risk/reward ratio has taken a more favourable view for Equities.
Let’s examine the U.S. Equity Asset Class against the Bond Asset class (the top 2 asset classes in the SIA Asset Class rankings) by looking at the comparison chart of the iShares Core S&P 500 ETF (IVV) vs. the iShares Core U.S. Aggregate Bond ETF (AGG). We will also examine the U.S. Equity Asset Class against the Commodity Asset Class (lowest ranked asset class) by looking at the comparison chart of the IVV vs. GCC.
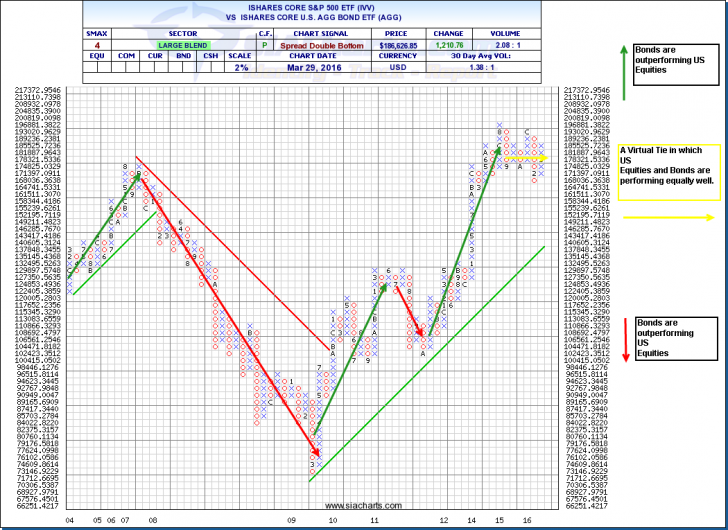
iShares Core S&P 500 ETF (IVV) vs. the iShares Core U.S. Aggregate Bond ETF (AGG)
In looking at the comparison chart of the iShares Core S&P 500 ETF (IVV) vs. the iShares Core U.S. Aggregate Bond (AGG), we see that US Equites outperformed US Bonds up until November 2007. From Nov 2007 to the Spring of 2009, we can see Bonds outperforming Equites on a relative strength basis. A change in leadership occurred in April of 2009 to June 2011 where we seen Equities outperform Bonds. Following this was a brief outperformance of Bonds from July 2011 to October 2011. What has transpired since then is Equities outperforming Bonds from the fall of 2011 to August of last year. We have now seen a sideways trading pattern materialize where US Equites and Bonds performing fairly evenly since August of last year until today. In light of this sideways movement in which US Equities and Bonds have relatively moved over the last nine months, Bonds is currently winning this head to head relationship with a VS SMAX of 4 in this comparison showing that AGG is currently winning against IVV.
There are favourable risk/reward opportunities in individual U.S. equity stocks, ETFs, and mutual funds when we focus in on certain sectors or segments of the U.S. Equity market that still give great relative strength opportunities that may outperform the overall Bond market that can be considered. For help finding these opportunities, utilize the sector rankings or the SIA U.S. Equity reports for the investment type you are looking for specific individual ideas. The comparison chart analysis against the broad U.S. Bond and U.S. Equity benchmarks is useful for keeping the big picture in mind from a top-down approach to help with overall asset allocation weightings and go forward outlook.
Click on Image to Enlarge

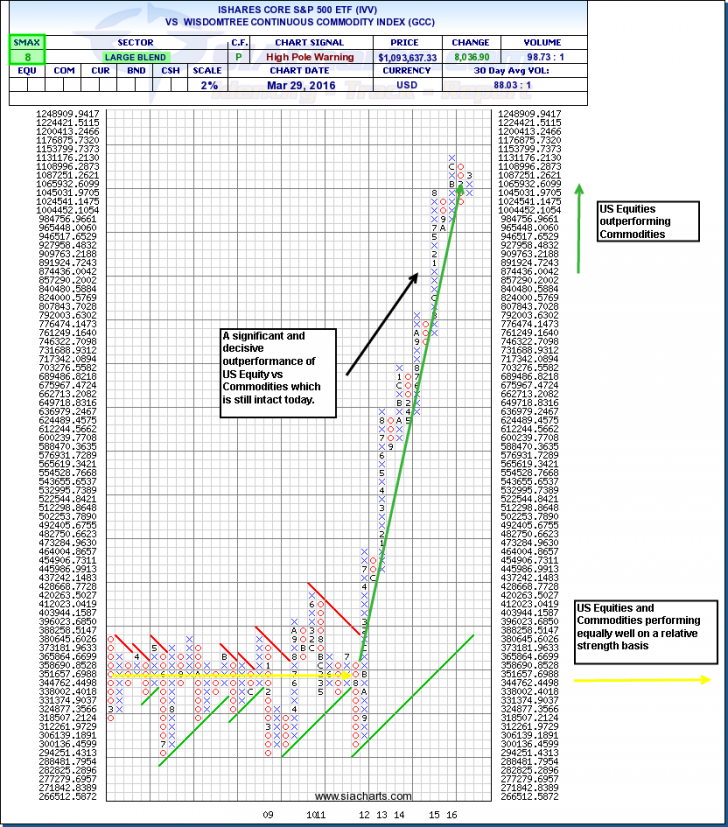
iShares Core S&P 500 ETF (IVV) vs. WisdomTree Continuous Commodity Index ETF (GCC)
Now let’s examine the U.S. Equity Asset class against the Commodity Asset class which, as mentioned, is in the bottom of our SIA Asset Class Rank list. We will use the WisdomTree Continuous Commodity Index ETF (GCC) in a comparison vs. U.S. Equity, which we featured two weeks ago individually in a past Equity Leaders Weekly.
In looking at the comparison chart of the iShares Core S&P 500 ETF (IVV) vs. GCC, we see that from the period of March 2008 to late 2011 there was a virtual tie where U.S. Equites and Commodities performed equally well. But since then, we see a decisive relative outperformance in US Equity vs. Commodities which continues to be intact today. The stock price performance of IVV from the end of 2011 to today is a 73% positive return. While the price performance of GCC from the end of 2011 to today yielded a loss of 39%. This is a difference of 112% in performance just by considering where each asset class is positioned within our Asset Class Rank List. With a VS SMAX Score of 8, IVV is still showing higher relative strength against GCC.
In light of this, it is always important to consider the SIA Asset Class Rank when making your investment decisions for a top-down approach to help understand the risk/reward ratio of where the best opportunities are. Staying away from Asset Classes at or near the bottom of the Asset Class Rank list and focusing on getting exposure to Asset Classes near or at the top of the rankings can significantly reduce your overall risk by ensuring you are always in the lower risk asset at any given point in time.
For a more in-depth analysis on the relative strength of the equity markets, bonds, commodities, currencies, etc. or for more information on SIACharts.com, you can contact our customer support at 1-877-668-1332 orsiateam@siacharts.com.
Click on Image to Enlarge

SIACharts.com specifically represents that it does not give investment advice or advocate the purchase or sale of any security or investment. None of the information contained in this website or document constitutes an offer to sell or the solicitation of an offer to buy any security or other investment or an offer to provide investment services of any kind. Neither SIACharts.com (FundCharts Inc.) nor its third party content providers shall be liable for any errors, inaccuracies or delays in content, or for any actions taken in reliance thereon.
Copyright © SIACharts.com


