Beware bad multi-factor products
by Corey Hoffstein, Newfound Research
Summary
- Multi-factor portfolios are a great way to diversify across multiple factors that can potentially create excess risk-adjusted returns while simultaneously smoothing out relative performance volatility.
- There are two ways we’ve seen manufacturers build multi-factor portfolios: (1) combining independent portfolios of factors, or (2) picking stocks that have the highest exposure to all the factors.
- We believe approach #2 is fundamentally flawed when momentum is one of the factors incorporated.
It was only a matter of time before multi-factor products found their way to market.
Multi-factor products take popular investment factors – like value, size, momentum, and low volatility – and smash them all together into one portfolio. The notion behind the idea is noble: factor premiums vary over time so if we can blend them together, we can exploit diversification and reduce relative performance volatility.
Most implementations we’ve seen so far? Far less noble.
Product manufacturers seem to walk two paths when it comes to building these portfolios. On the first path, they build a portfolio for each factor and then blend all those portfolios together. On the second path, they give each stock a score based on its exposure to each factor and inclusion in the portfolio is based upon the cumulative score. You can think of this as sort of a “best-of-breed” approach.
But we think this “best-of-breed” approach is flawed when momentum is one of the factors incorporated.
Let’s simplify with pictures an example of just two factors: value and momentum.
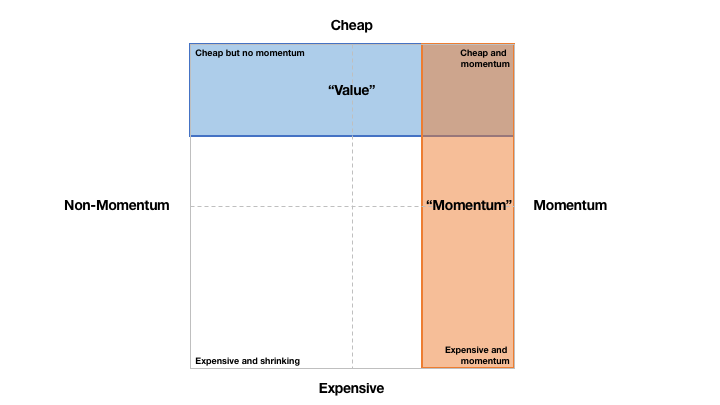
Here is how approach #1 looks.
In this approach, all stocks labeled “value” and “momentum” are held. We can think of this as an “or” approach: value or momentum. Here is how approach #2 does it:
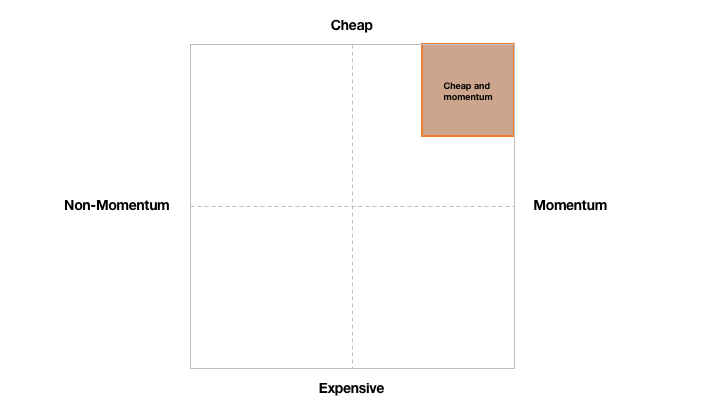
Approach #2 will only hold the cross-section of stocks exhibiting both value and momentum characteristics, the “and” approach.
At face value, neither approach seems wrong. This certainly isn’t a “growth is not the opposite of value” problem, and removing expensive stocks that have momentum and low momentum stocks that have value might seem to more effectively isolate the intersection of the factors.
The problem we see is one of premium maturity. What is premium maturity? Premium maturity is the length of time we expect to have to hold a security to capture the excess return potential from the factor.
For example, value tends to have a very long premium maturity – often 3-to-5 years. Momentum, on the other hand, has a much shorter premium maturity – often only a few months.
One way to think about this is through a series of questions: “how long is a value stock likely to stay cheap?” and “how long is a momentum stock likely to have positive momentum?” Often there is no significant rush to buy value: cheap stays cheap. Alternatively, momentum changes hands quickly.
Another simple way to think about this is from the perspective of building a portfolio. If we are building a value portfolio, we likely won’t have to reallocate the portfolio for quite some time. If we are building a momentum portfolio, we’ll likely have to reallocate it on a monthly basis. That’s premium maturity in action.
So why is this a problem?
To explore, we’ll simplify our example further by looking at just one stock using approach #2.
On a technical note, the way most manufacturers combine factor scores in approach #2 is bynormalizing them (which typically puts the factor score between -3 and 3) and then averaging them. We’ll use the same framework.
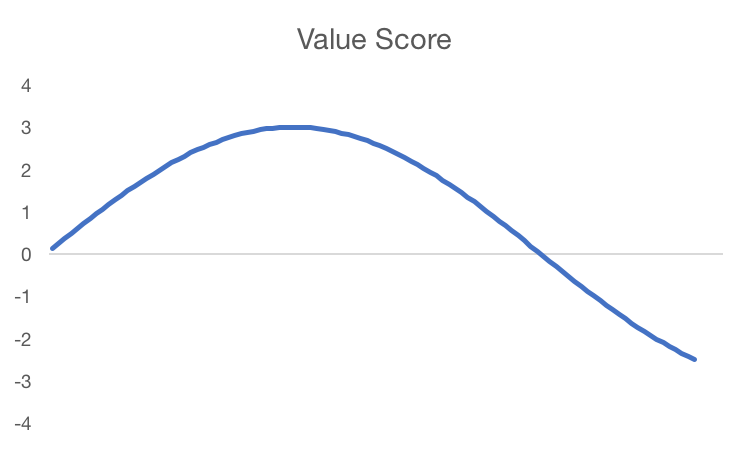
Here is the stock’s value score over time. A higher number means it is cheap, a low number means it is expensive.
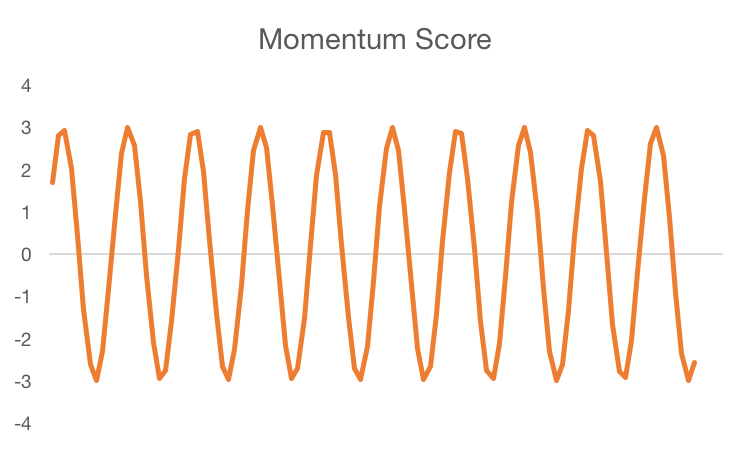
Here is the momentum score over time. A high number means it is exhibiting positive momentum while a low number means it is exhibiting negative momentum.
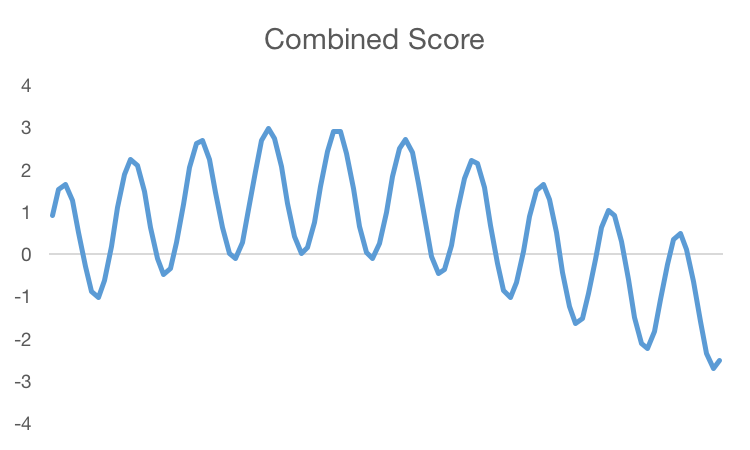
Here is the combined score:
Despite being the average between the value and the momentum scores, the combined score is influenced a whole lot more by the momentum score than the value score.
Consider this: let’s assume that this stock is included in a factor portfolio when its score is greater than 2. So if we were just building a value portfolio, the stock would be included when the value score is greater than 2; if we were just building a momentum portfolio, the stock would be included when the momentum score is greater than 2. The same goes for our multi-factor approach.
Now consider this: over the time-frame that the stock was identified for inclusion in a value portfolio, it only ended up being included in the multi-factor portfolio 35.7% of the period.
Why is that? Because momentum completely influenced the decision.
At face value, this doesn’t make much sense: we’re averaging the scores of value and momentum together. Why does momentum carry so much more weight than value?
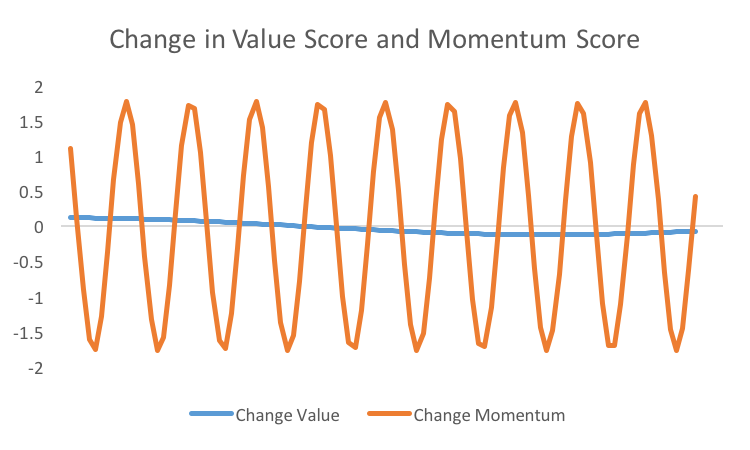
The answer lies in the influence that each factor has on the change in the combined score (math geeks will note that we are talking about the derivative here). Let’s look at how much the value and momentum scores change from period-to-period:
We can see that the value score doesn’t change very quickly or significantly; the momentum score does. So the change in our combined score will be driven almost entirely by the change in the momentum score.
In fact, using the simple model we set out here, the relative influence of the factors will be inversely proportional to the relative length of their premium maturity. So if we believe value has a premium maturity of 5 years and momentum has a premium maturity of 4 months (1/3rd of a year), then momentum has about 15x the influence of value on the change of the combined score.
So why isn’t this problem obvious? As we see it, the picture we drew for approach #2 does not capture all the salient features of factors: namely the drift that can occur over time. If we think of a stock being plotted in the value / momentum style box space over time, changes along the momentum axis will happen much more quickly than changes along the value axis. So whether the stock falls within the top-right box will be driven almost entirely by momentum; the stock will move along the top third of the box, oscillating to the left and right, yet always remaining a value stock until that premium matures.
So what does that mean? In our opinion, approach #2 means that inclusion in the portfolio will likely be primarily driven by the factor with the shortest premium maturity. In most cases, this will be momentum. Therefore, most multi-factor portfolios that take approach #2 will really just be momentum portfolios in drag.
Copyright © Newfound Research


