by Don Vialoux, Timingthemarket.ca
Pre-opening Comments for Monday March 28th
U.S. equity index futures were higher this morning. S&P 500 futures were up 5 points in pre-opening trade.
Index futures were virtually unchanged following release of economic news at 8:30 AM EDT. Consensus for February Personal Income was an increase of 0.1% versus a gain of 0.5% in January. Actual was an increase of 0.2%. Consensus for February Personal Spending was an increase of 0.1% versus a downwardly revised 0.1% gain in January. Actual was an increase of 0.1%
Hologic added $0.64 to $34.99 and Centene gained $0.94 to $64.70. Both will join the S&P 500 Index tomorrow. Hologic replaces Ensco and Centene replaces Pepco.
Berkshire Hathaway A (BRK.A $210,530) is expected to open higher after UBS initiated coverage on the stock with a Buy rating. Target price is $244,500
Yahoo gained $0.64 to $35.50 on news that combined Microsoft and private companies are in preliminary discussions to purchase all or part of the company.
EquityClock’s Daily Market Comment
Following is a link:
http://www.equityclock.com/2016/03/24/stock-market-outlook-for-march-28-2016/
Note seasonality charts on Durable Goods Orders and Initial Claims
Economic News This Week
February Personal Income to be released at 8:30 AM EDT on Monday is expected to increase 0.1% versus a gain of 0.5% in January. February Personal Spending is expected to increase 0.1% versus a gain of 0.5% in January
January Case/Shiller 20 City Home Price Index to be released at 9:00 AM EDT on Tuesday is expected to remain unchanged on a year-over-year basis at 5.7%.
March Consumer Confidence Index to be released at 10:00 AM EDT on Tuesday is expected to increase to 94.5 from 92.2 in February.
March ADP Private Employment to be released at 8:15 AM EDT on Wednesday is expected to slip to 196,000 from 214,000 in February
Weekly Jobless Claims to be released at 8:30 AM EDT on Thursday is expected to slip to 264,000 from 265,000 last week.
Canadian January Real GDP to be released at 8:30 AM EST on Thursday is expected to increase 0.2% versus a gain of 0.2% in December.
March Chicago PMI to be released at 8:30 AM EDT on Thursday is expected to improve to 49.9 from 47.6 in February.
March Non-Farm Payrolls to be released at 8:30 AM EDT on Friday are expected to slip to 200,000 from 242,000 in February. March Private Non-Farm Payrolls are expected to slip to 195,000 from 230,000 in February. March Unemployment Rate is expected to remain the same as February at 4.9%. March Hourly Earnings are expected to increase 0.3% versus a decline of 0.1% in February.
February Construction Spending to be released at 10:00 AM EDT on Friday is expected to increase 0.2% versus a gain of 1.5% in January
March ISM to be released at 10:00 AM EDT on Friday is expected to increase to 50.6 from 49.5 in February.
March Michigan Sentiment to be released at 10:00 AM EDT on Friday is expected to increase to 90.5 from 90.0 in February.
Earnings News This Week
Tuesday: Lennar
Wednesday: Carnival
Friday: BlackBerry
The Bottom Line
Two strategies: Short term traders can take profits where momentum has rolled over.
Investors holding seasonal opportunities lasting until May can buy on weakness when short term momentum indicators show signs of bottoming.
Equity Indices and Related ETFs
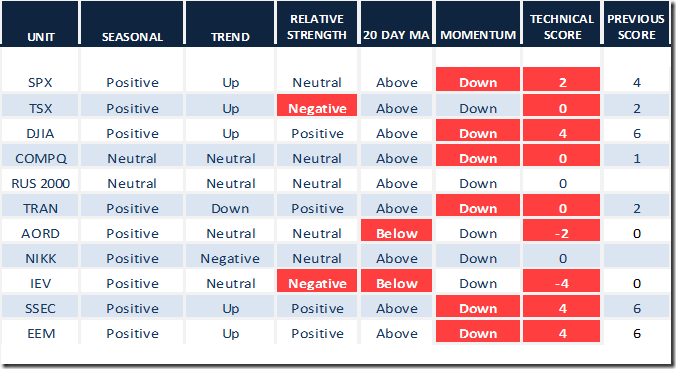
Daily Seasonal/Technical Equity Trends for March 24th 2016
Green: Increase from previous day
Red: Decrease from previous day
Calculating Technical Scores
Technical scores are calculated as follows:
Intermediate Uptrend based on at least 20 trading days: Score 2
Higher highs and higher lows
Intermediate Neutral trend: Score 0
Not up or down
Intermediate Downtrend: Score -2
Lower highs and lower lows
Outperformance relative to the S&P 500 Index: Score: 2
Neutral Performance relative to the S&P 500 Index: 0
Underperformance relative to the S&P 500 Index: Score –2
Above 20 day moving average: Score 1
At 20 day moving average: Score: 0
Below 20 day moving average: –1
Up trending momentum indicators (Daily Stochastics, RSI and MACD): 1
Mixed momentum indicators: 0
Down trending momentum indicators: –1
Technical scores range from -6 to +6. Technical buy signals based on the above guidelines start when a security advances to at least 0.0, but preferably 2.0 or higher. Technical sell/short signals start when a security descends to 0, but preferably -2.0 or lower.
Long positions require maintaining a technical score of -2.0 or higher. Conversely, a short position requires maintaining a technical score of +2.0 or lower.
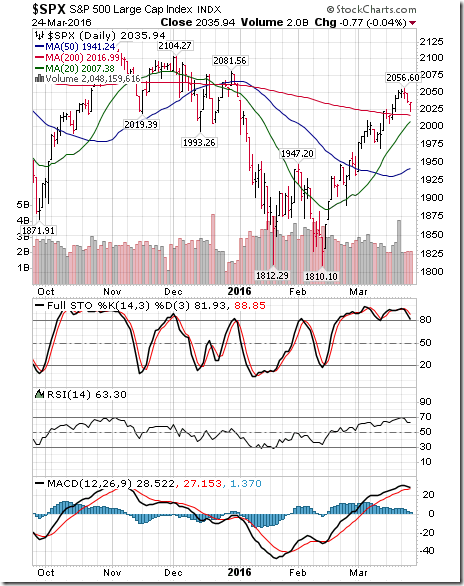
The S&P 500 Index lost 13.61 points (0.66%) last week. Intermediate trend remains up. The Index remains above its 20 day moving average. Short term momentum indicators are overbought and trending down.
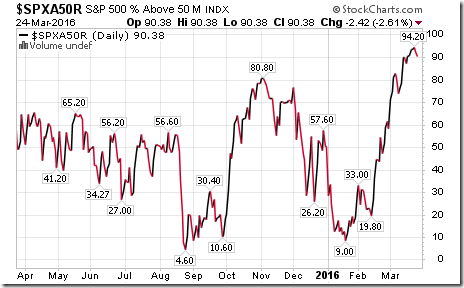
Percent of S&P 500 stocks trading above their 50 day moving average slipped last week to 90.38% from 93.40%. Percent is intermediate overbought and showing early signs of rolling over.
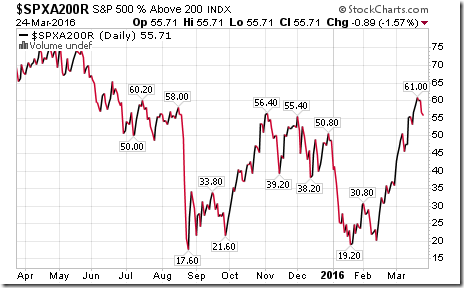
Percent of S&P 500 stocks trading above their 200 day moving average dropped last week to 55.71% from 61.00%. Percent is intermediate overbought and showing early signs of rolling over.
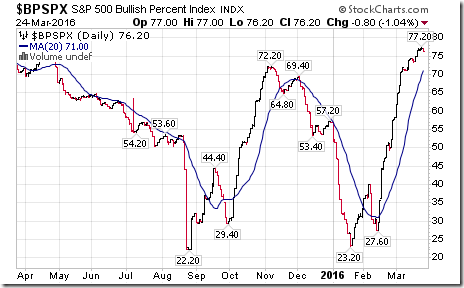
Bullish Percent Index for S&P 500 stocks slipped last week to 76.20% from 76.60%, but remained above its 20 day moving average. The Index remains intermediate overbought and showing early signs of peaking
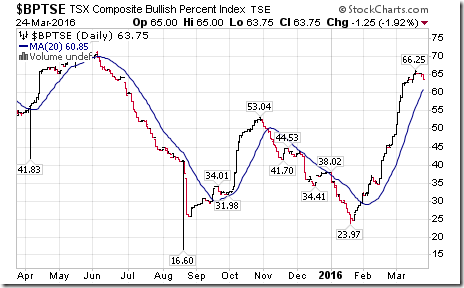
Bullish Percent Index for TSX Composite stocks slipped last week to 63.75% from 65.42%, but remained above its 20 day moving average. The Index remains intermediate overbought and showing early signs of rolling over.
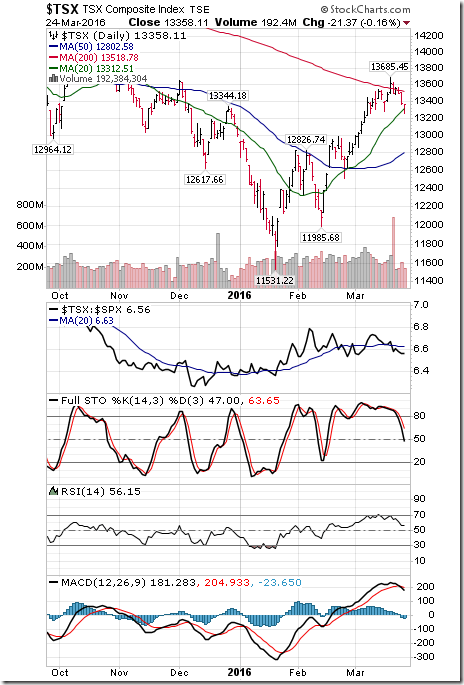
The TSX Composite Index slipped 139.02 points (1.03%) last week. Intermediate trend remained up (Score: 2). Strength relative to the S&P 500 Index changed last week to Negative from Neutral (Score: -2). The Index remains above its 20 day moving average (Score: 1). Short term momentum indicators have rolled over from overbought levels and are trending down (Score: -1). Technical score dropped last week to 0 from 4.
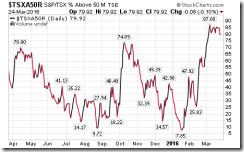
Percent of TSX stocks trading above their 50 day moving average dropped last week to 79.92% from 85.00%. Percent has rolled over from an intermediate overbought level and is trending down.
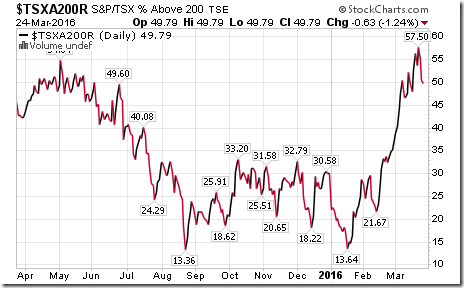
Percent of TSX Stocks trading above their 200 day moving average dropped last week to 49.79% from 53.75%. Percent has rolled over from an intermediate overbought level and is trending down.
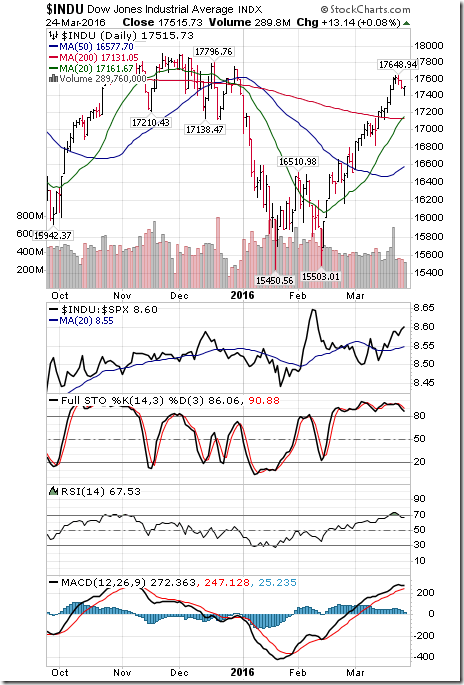
The Dow Jones Industrial Average dropped 86.43 points (0.49%) last week. Intermediate trend remained up. Strength relative to the S&P 500 Index remained Positive. The Average remained above its 20 day moving average. Short term momentum indicators are overbought and have rolled over. Technical score slipped last week to 4 from 6.
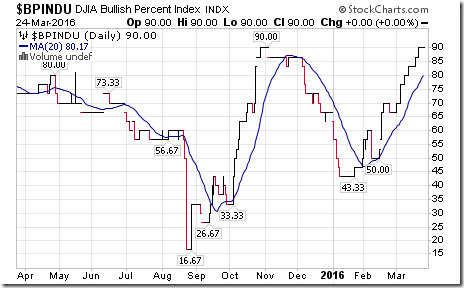
Bullish Percent Index for Dow Jones Industrial Average stocks increased last week to 90.00% from 86.67% and remained above its 20 day moving average. The Index is trending up and remained intermediate overbought, but has yet to show signs of peaking.
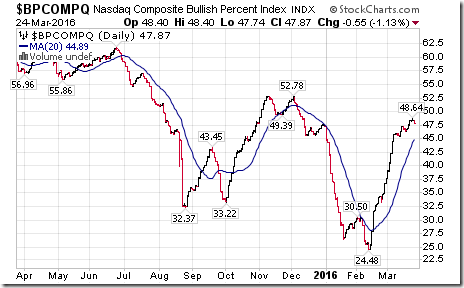
Bullish Percent Index for NASDAQ Composite stocks increased last week to 47.87% from 47.52% and remained above its 20 day moving average. The Index remains in an intermediate uptrend.
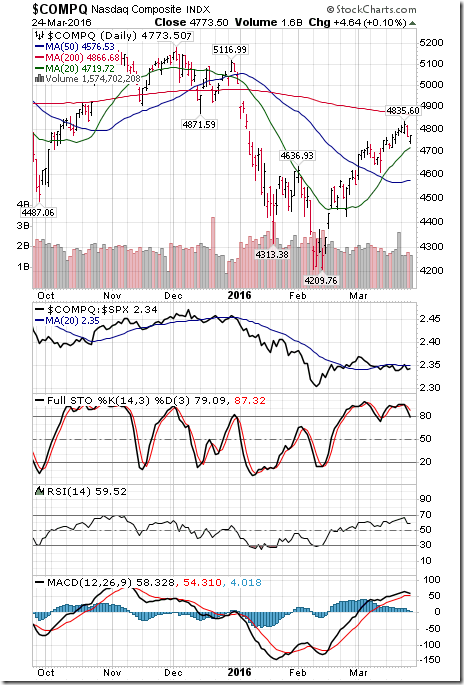
The NASDAQ Composite Index slipped 22.15 points (0.46%) last week. Intermediate trend remained Neutral. Strength relative to the S&P 500 Index remained Neutral. The Index remained above its 20 day moving average. Short term momentum indicators are trending down. Technical score slipped last week to 0 from 1.
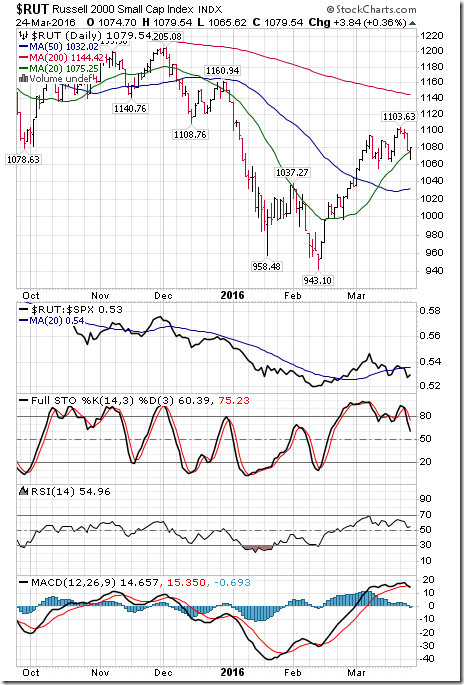
The Russell 2000 Index dropped 22.16 points (2.01%) last week. Intermediate trend remained Neutral. Strength relative to the S&P 500 Index remained Neutral. The Index remained above its 20 day moving average. Short term momentum indicators are trending down. Technical score slipped last week to 0 from 1.
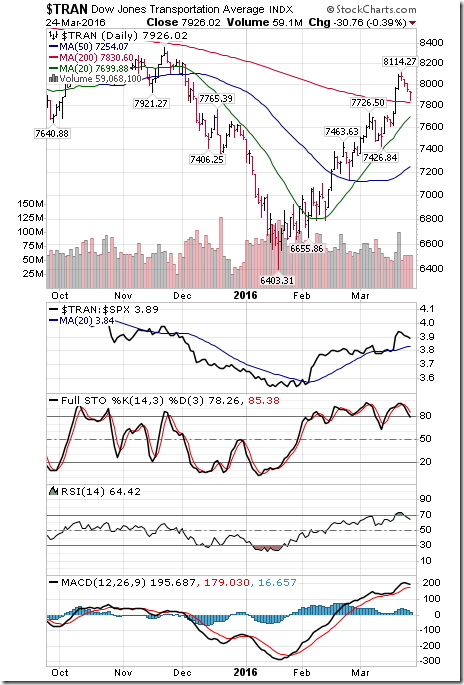
The Dow Jones Transportation Average dropped 149.18 points (1.85%) last week. Intermediate trend remained down. Strength relative to the S&P 500 Index remained Positive. Short term momentum indicators have rolled over and are trending down. Technical score dropped last week to 0 from 2.
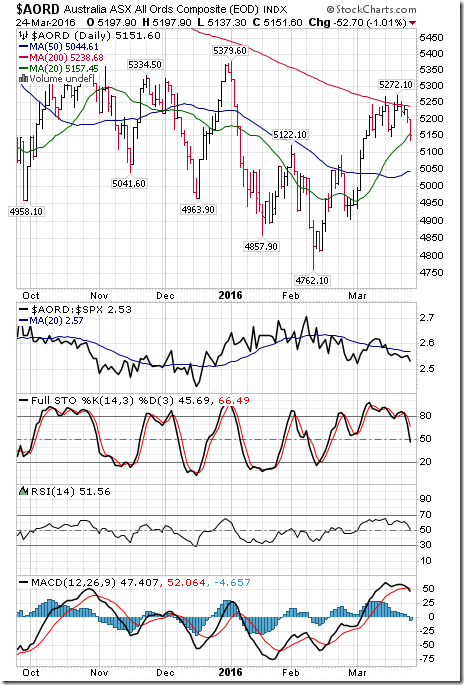
The Australia All Ordinaries Composite Index dropped 87.70 points (1.59%) last week. Intermediate trend remained Neutral. Strength relative to the S&P 500 Index changed to Negative from Neutral. The Index dropped below its 20 day moving average. Technical Short term momentum indicators are trending down. Technical score dropped last week to -2 from 0.
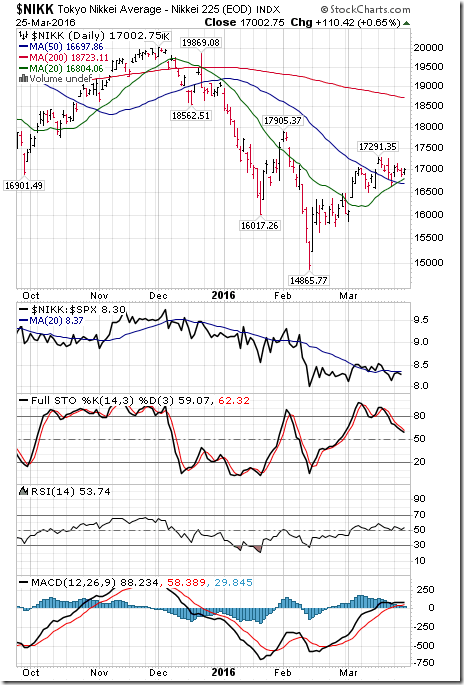
The Nikkei Average added 277.94 points (1.66%) last week. Intermediate trend remained down. Strength relative to the S&P 500 Index remained Neutral. The Average remained above its 20 day moving average. Short term momentum indicators are trending down. Technical score remained last week at 0.
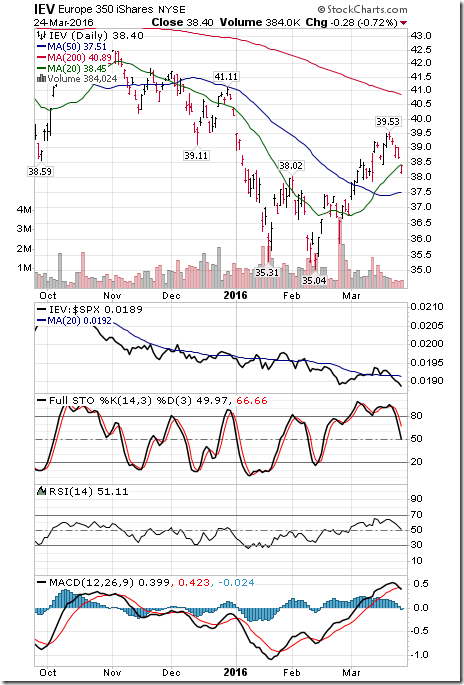
Europe 350 iShares dropped $1.00 (2.54%) last week. Intermediate trend remained Neutral. Strength relative to the S&P 500 Index changed to Negative from Positive. Units fell below their 20 day moving average on Friday. Short term momentum indicators have rolled over and are trending down. Technical score dropped last week to -4 from +4.
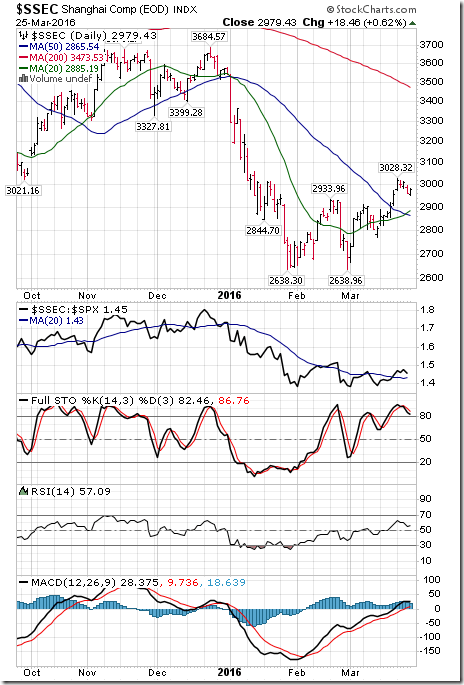
The Shanghai Composite Index added 24.82 points (0.82%) last week. Intermediate trend remained up. Strength relative to the S&P 500 Index remained Positive. The Index remained above its 20 day moving average. Short term momentum indicators are overbought and showing early signs of rolling over. Technical score slipped last week to 4 from 6.
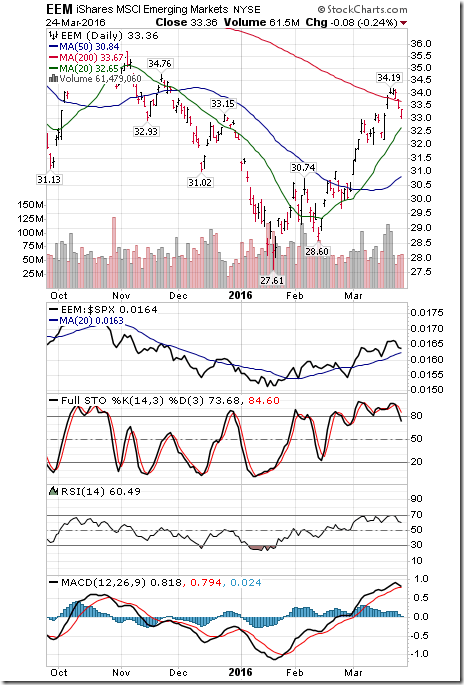
Emerging Markets iShares dropped $0.67 (1.97%) last week. Intermediate trend remained up. Strength relative to the S&P 500 Index remained Positive. Units remained above their 20 day moving average. Short term momentum indicators have rolled over and are trending down. Technical score dipped last week to 4 from 6.
Currencies
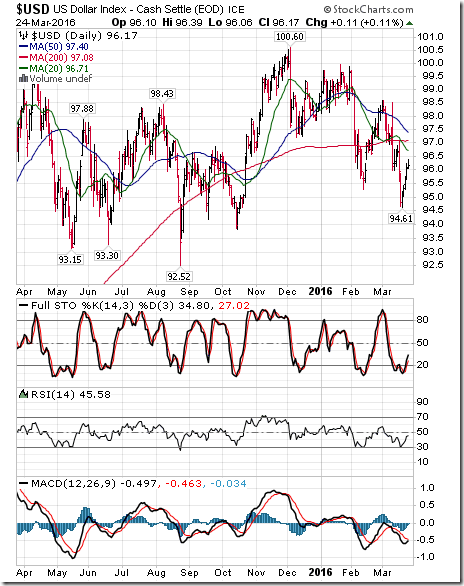
The U.S. Dollar Index added 1.06 (1.11%) last week. Intermediate trend remained down. The Index remained below its 20 day moving average. Short term momentum indicators have bottomed and are trending up.
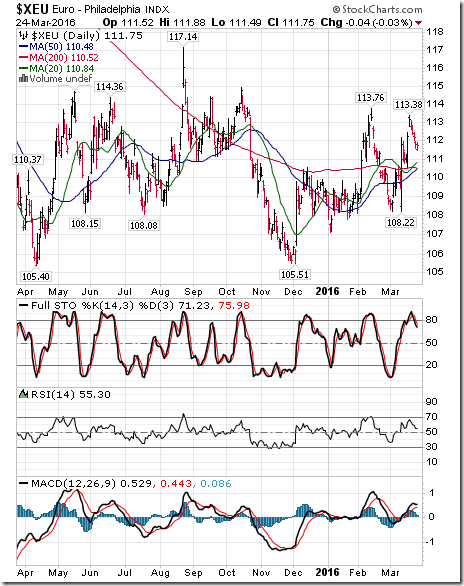
The Euro dropped 1.03 (0.91%) last week. Intermediate trend remained up. The Euro remained above its 20 day moving average. Short term momentum indicators are overbought and have rolled over.
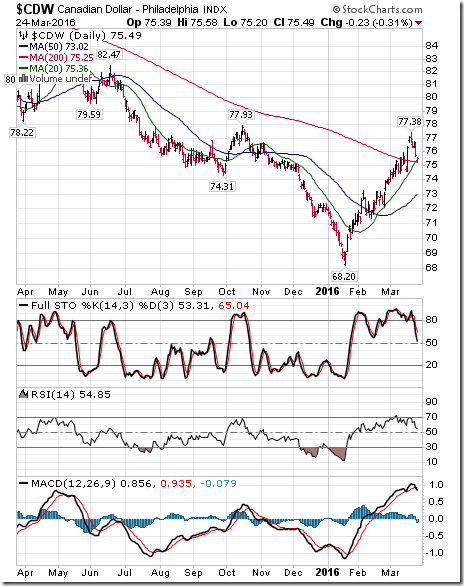
The Canadian Dollar dropped US1.21 cents (1.58%) last week. Intermediate trend remained up. The Canuck Buck remained above its 20 day moving average. Short term momentum indicators have rolled over from overbought levels and are trending down.
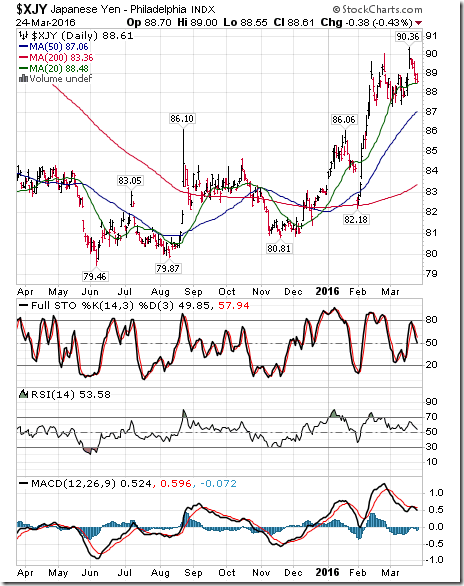
The Japanese Yen dropped 1.04 (1.16%) last week. Intermediate trend remained up. The Yen remains above its 20 day moving average. Short term momentum indicators are trending down.
Commodities
Daily Seasonal/Technical Commodities Trends for March 24th 2016
Green: Increase from previous day
Red: Decrease from previous day
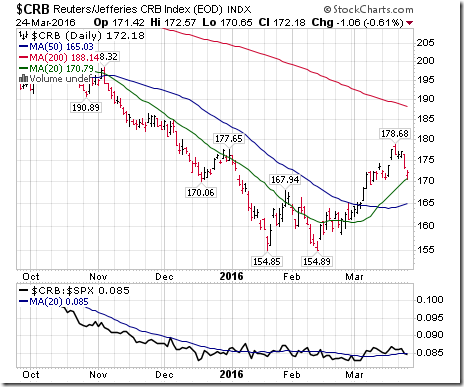
The CRB Index dropped 4.17 points (2.36%) last week. Intermediate trend remained up. Strength relative to the S&P 500 Index changed to Neutral from Positive. The Index remained above its 20 day moving average. Short term momentum indicators have rolled over and are trending down. Technical score dropped last week to 2 from 4.
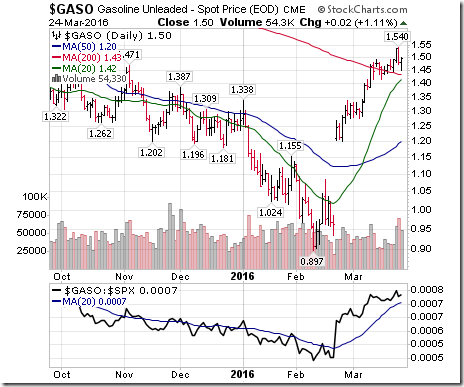
Gasoline gained $0.04 per gallon (2.74%) last week. Intermediate trend remains up. Strength relative to the S&P 500 Index remains Positive. Gas remains above its 20 day moving average. Short term momentum indicators are trending down. Technical score remained at 4
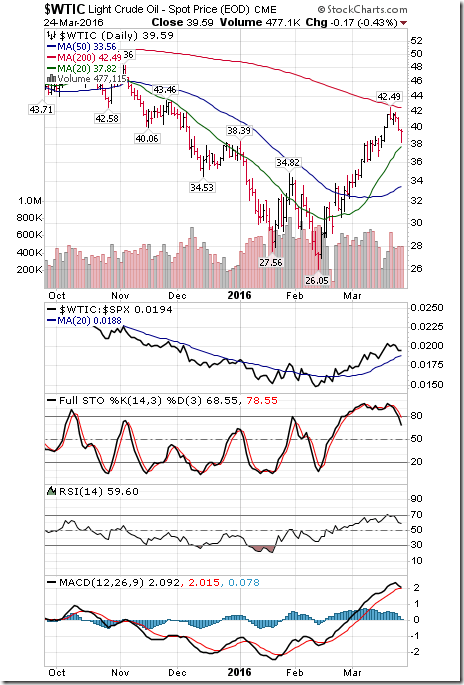
Crude Oil dropped $1.55 per barrel (3.77%) last week. Intermediate trend remained up. Strength relative to the S&P 500 Index remained Positive. Crude remained above its 20 day moving average. Short term momentum indicators are overbought and trending down. Technical score dipped last week to 4 from 6.
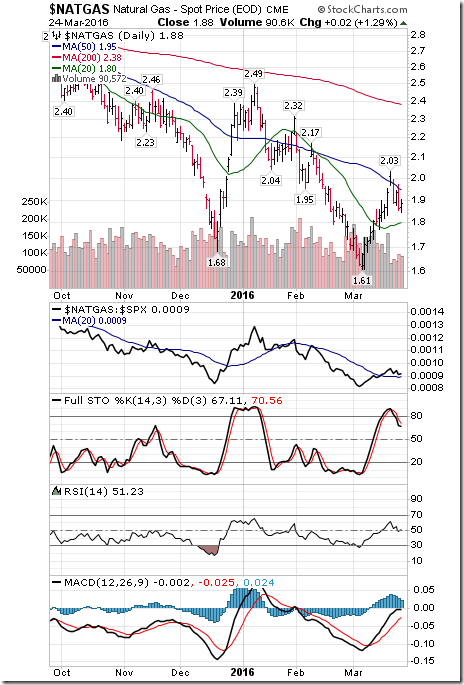
Natural Gas dropped $0.03 per MBtu (1.57%) last week. Intermediate trend remained down. Strength relative to the S&P 500 Index remained Neutral. “Natty” remained above its 20 day moving average. Short term momentum indicators have rolled over and are trending down. Technical score dropped to -2 from 0.
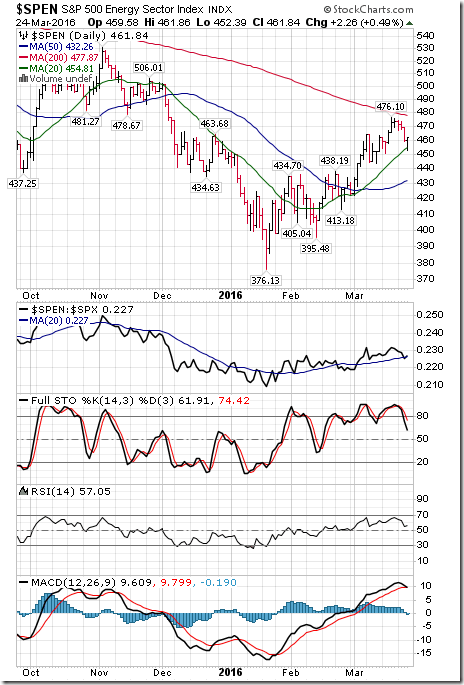
The S&P Energy Index dropped 11.51 points (2.43%) last week. Intermediate trend remained up. Strength relative to the S&P 500 Index changed to Neutral from Positive. The Index remained above its 20 day moving average. Short term momentum indicators have rolled over and are trending down. Technical score dropped last week to 2 from 5.
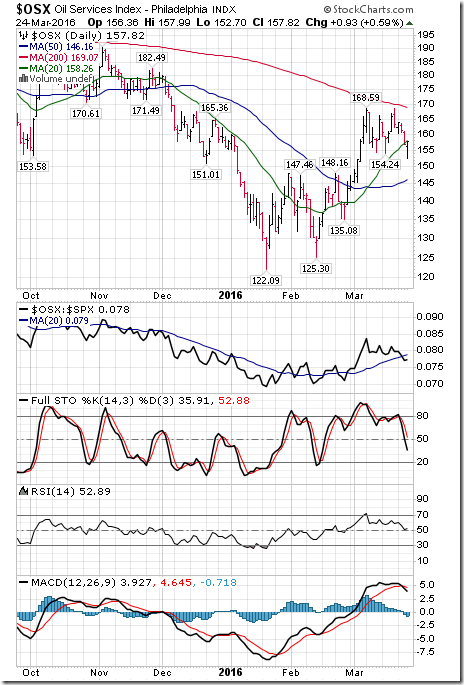
The Philadelphia Oil Services Index dropped 5.41 points (3.31%) last week. Intermediate trend remained up. Strength relative to the S&P 500 Index remained Neutral. The Index fell below its 20 day moving average. Short term momentum indicators are trending down. Technical score dropped last week to 0 from 5.
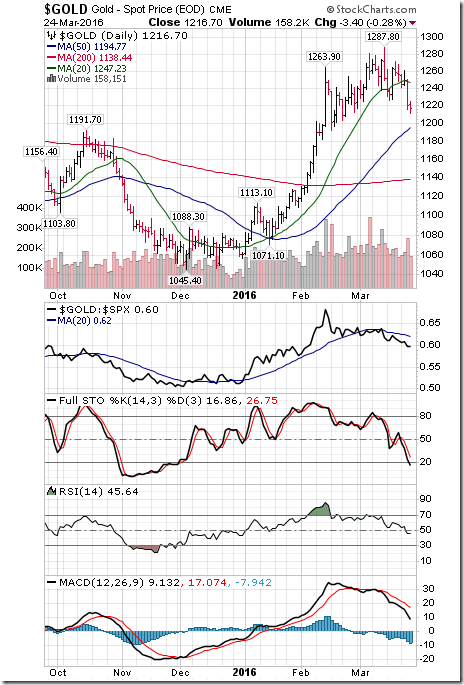
Gold dropped $37.60 per ounce (3.00%) last week. Intermediate trend remained up. Strength relative to the S&P 500 Index remained Negative. Gold fell below its 20 day moving average. Short term momentum indicators continued to trend down. Technical score dropped last week to -2 from 0
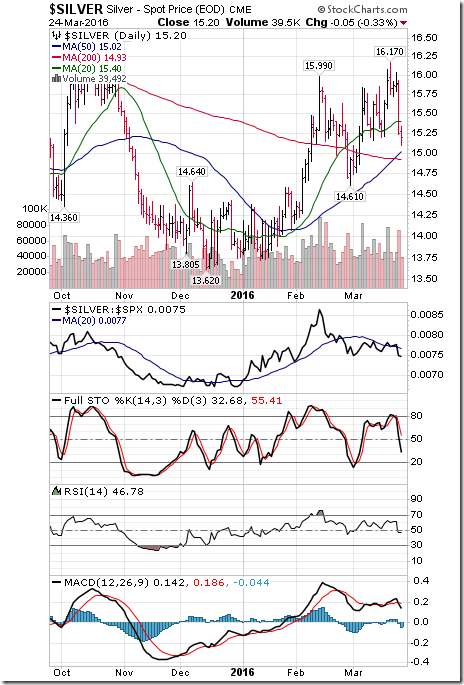
Silver dropped $0.61 per ounce (3.86%) last week. Intermediate trend remained up. Strength relative to the S&P 500 Index changed to Negative from Neutral. Silver moved below its 20 day moving average. Short term momentum indicators have rolled over and are trending down. Technical score dropped last week to -2 from 4.
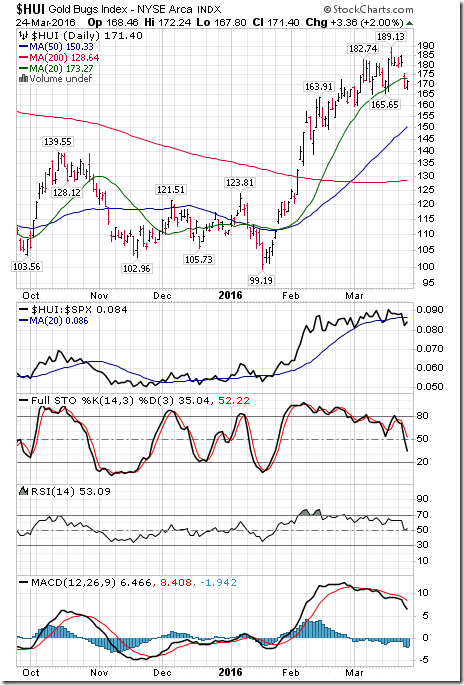
The AMEX Gold Bug Index dropped 9.92 points (5.47 %) last week. Intermediate trend remained up. Strength relative to the S&P 500 Index changed to Neutral from Positive. The Index fell below its 20 day moving average. Short term momentum indicators continue to trend down. Technical score dropped last week to 0 from 4.
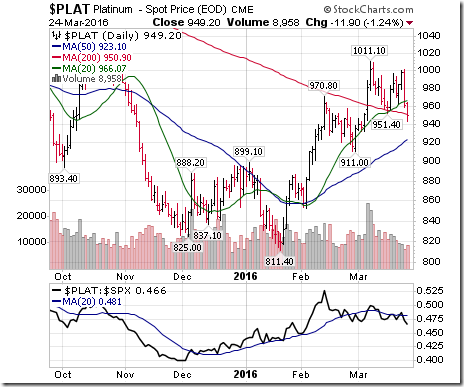
Platinum dropped $21.30 per ounce (2.19%) last week. Trend remains up. Relative strength turned Negative. PLAT dropped below its 20 day MA. Momentum: Down. Score: -2
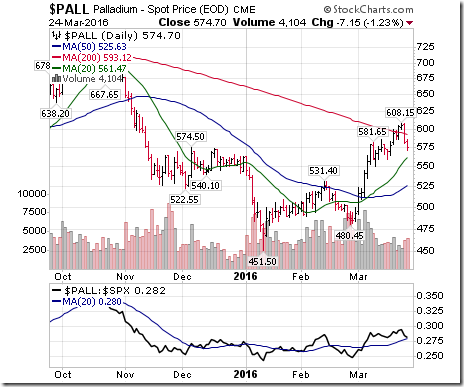
Palladium dropped $15.35 per ounce (2.60%) last week. Intermediate trend remains up. Strength relative to the S&P 500 Index changed to Neutral from Positive. PALL remained above its 20 day moving average. Short term momentum is trending down. Score dropped to -2
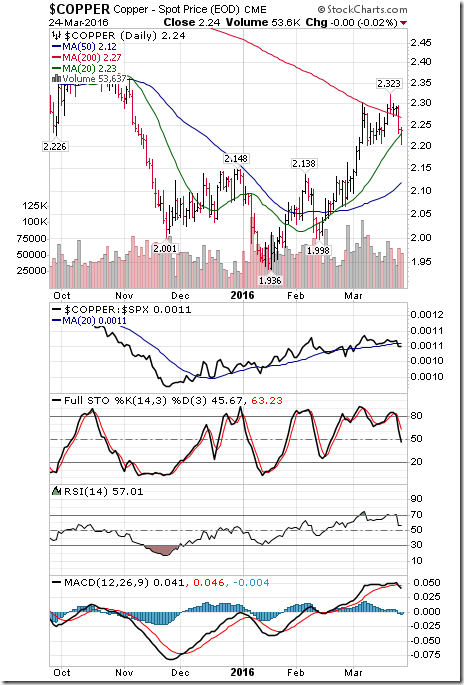
Copper dropped $0.04 per lb. (1.75%) last week. Intermediate trend remained Neural. Strength relative to the S&P 500 Index changed to Negative from Positive. Copper remained above its 20 day moving average. Short term momentum indicators are trending down. Technical score dropped to -2 from +2.
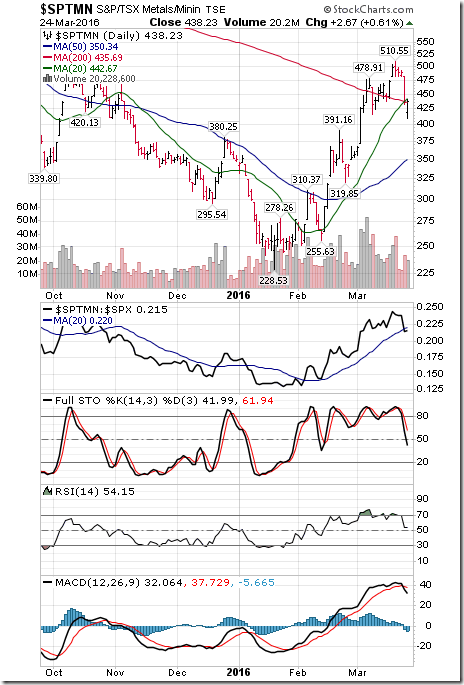
The TSX Metals & Mining Index dropped 54.47 points (11.05%) last week. Intermediate trend remained up. Strength relative to the S&P 500 Index changed to Neutral from Positive. The Index dropped below its 20 day moving average. Short term momentum indicators are trending down. Technical score dropped last week to 0 from 5.
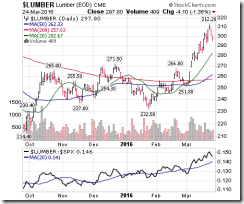
Lumber added $0.70 (0.24%) last week. Trend remains up. Relative Strength remains Positive. Lumber remains above its 20 day MA. Momentum has just turned down. Score: 4.
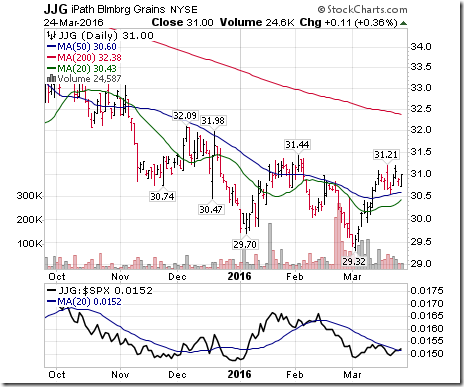
The Grain ETN added $0.33 (1.08%) last week. Trend remained down. Relative strength changed to Neutral from Negative. Units remained above their 20 day moving average. Short term momentum indicators are mixed. Technical score improved to -1 from -4.
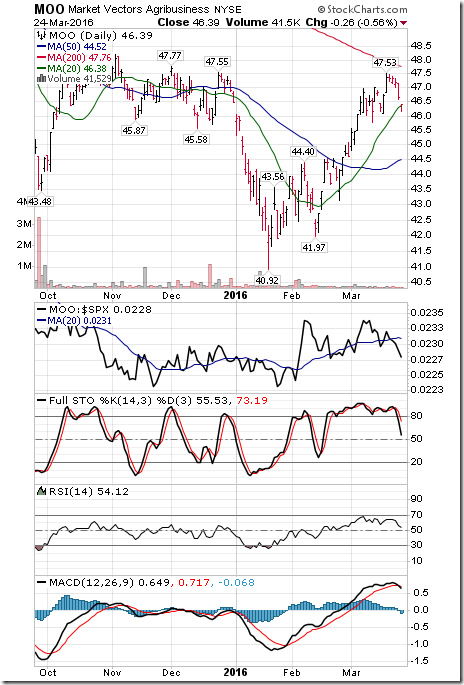
The Agriculture ETF dropped $0.96 (2.03%) last week. Intermediate trend remains up. Strength relative to the S&P 500 Index changed to Negative from Positive. Units remain above their 20 day moving average. Short term momentum indicators are trending down. Technical score dropped to 0 from 6
Interest Rates
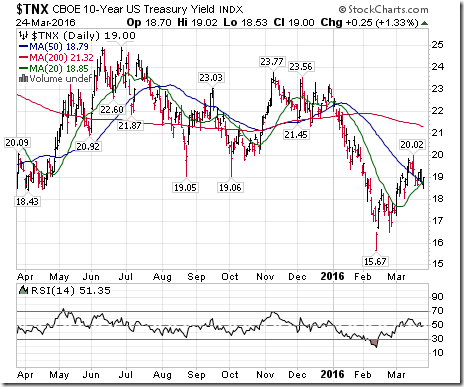
Yield on 10 year Treasuries increased 2.9 basis points (1.55%) last week. Intermediate trend remains down. Yield remains above its 20 day moving average. Short term momentum indicators are mixed.
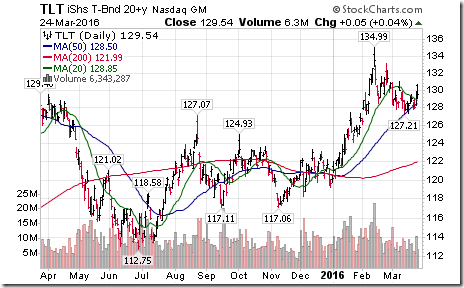
Price of the long term Treasury ETF added $0.48 (0.37%) last week. Intermediate trend remains up. Short term momentum indicators are trending up.
Other Issues
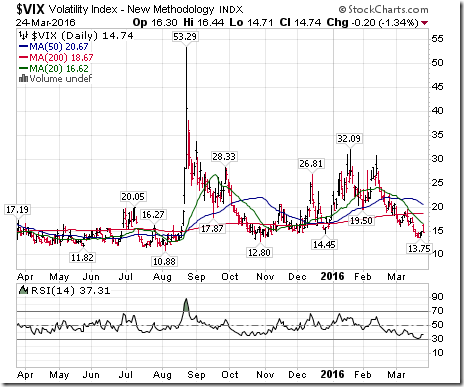
The VIX Index gained 0.72 (5.14%) last week. Intermediate trend remains down. The Index remains below its 20 day moving average. Short term momentum indicators are oversold and turning higher.
Earnings news this week is sparse. Ten S&P 500 companies have released first quarter results to date and only four are scheduled to release results this week. ‘Tis the season until next week when companies pre-empt negative first quarter reports!
Consensus first quarter estimates continued to deteriorate last week. According to FactSet, first quarter consensus for S&P 500 companies is a decline on a year-over-year basis of 8.7% for earnings and 1.1% in revenues. Prospects beyond the first quarter improve. Second quarter consensus is a decline of 2.4% for earnings and 0.9% for revenues. Third quarter consensus is a gain of 3.9% in earnings and a gain of 1.8% in revenues. Fourth quarter consensus is a gain of 9.0% for earnings and 4.1% gain for revenues. Historically, equity markets have moved higher in the first half of April in anticipation of good news released in first quarter reports that frequently are released at annual meetings (CEOs love to released upbeat news at annual meetings). However, given the sharp decline in first quarter earnings to be released this year, chances of equity prices moving higher in anticipation of good news is less than average.
Economic focus this week is on the March Employment Report to be released on Friday. The report is expected show another strong increase in Non-farm Payrolls (but not as strong as in February and (more important) a strong increase on Hourly Wages. Other economic news this week is expected to confirm a slight acceleration of economic growth in the U.S..
Short and intermediate technical indicators for most equity markets and primary sectors are overbought and have rolled over.
Seasonal influence by most developed nation equity markets and economically sensitive sectors (Materials, Industrials, Consumer Discretionary, Financials) are positive until at least early May.
Sectors
Daily Seasonal/Technical Sector Trends for March 24th 2016
Green: Increase from previous day
Red: Decrease from previous day
StockTwits Released on Thursday
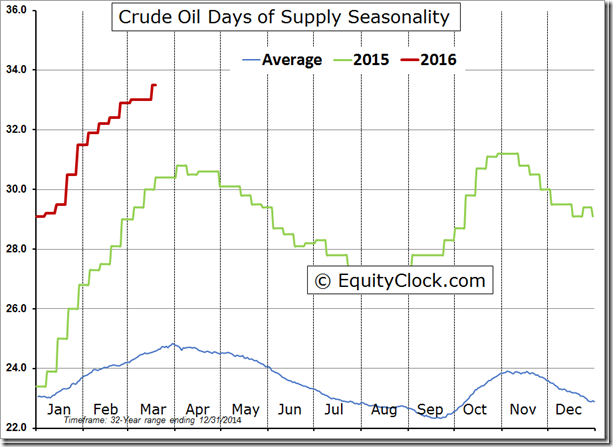
Days of supply of oil inching toward the all-time high of 34.2 charted during the oil glut of 1983.
Technical action by S&P 500 stocks to 10:00 AM: Quiet. One stock broke resistance $ACN. None broke support.
Accountability Report
A wide variety of international ETF trading on U.S. exchanges with favourable seasonality were supported in StockTwits and Tech Talk reports. All show signs of losing momentum. Accordingly, traders expecting a short term momentum play can take profits. Following is a summary:
Emerging Market iShares (EEM $33.36) supported in a StockTwit on February 23rd at $30.83
Brazil iShares (EWZ $25.68) supported in a StockTwit on February 23rd at $20.84
iShares FTSE China 25 ETF (FXI $32.74) supported in a StockTwit on February 23rd at $31.31
South Korea iShares (EWY $51.56) supported in a StockTwit on March 4th at $48.87
iShares EAFA (EFA $56.35) supported in a StockTwit on March 4th at $55.85
UK iShares (EWU $15.39) supported in a StockTwit on March 4th at $15.46
Disclaimer: Seasonality and technical ratings offered in this report by www.timingthemarket.ca and www.equityclock.com are for information only. They should not be considered as advice to purchase or to sell mentioned securities. Data offered in this report is believed to be accurate, but is not guaranteed
Copyright © DV Tech Talk, Timingthemarket.ca


![clip_image002[5] clip_image002[5]](https://advisoranalyst.com/wp-content/uploads/2019/08/4d6a034e96ae2552d7c76c7fa7cb35b6.png)
![clip_image002[7] clip_image002[7]](https://advisoranalyst.com/wp-content/uploads/2019/08/b0484d2dfed6837798e9a34969f8b401.png)
![clip_image002[1] clip_image002[1]](https://advisoranalyst.com/wp-content/uploads/2019/08/c1ceb096498dc55a454f0136c4bd2b12.png)
![clip_image003[1] clip_image003[1]](https://advisoranalyst.com/wp-content/uploads/2019/08/3147d50b7fbf7c7d914a853ac69cc56e.png)
![clip_image004[1] clip_image004[1]](https://advisoranalyst.com/wp-content/uploads/2019/08/920fdd656096166a0ce181dcf13e3248.png)
![clip_image005[1] clip_image005[1]](https://advisoranalyst.com/wp-content/uploads/2019/08/0102d74b0619275b3edbb5d002bae115.png)
![clip_image006[1] clip_image006[1]](https://advisoranalyst.com/wp-content/uploads/2019/08/4d4249b1c5e65cf9008bd30c41f073fe.png)
![clip_image007[1] clip_image007[1]](https://advisoranalyst.com/wp-content/uploads/2019/08/812e7e83dd558f57c99acae5c3692945.png)
![clip_image008[1] clip_image008[1]](https://advisoranalyst.com/wp-content/uploads/2019/08/1cc882e998f4c8d6f7e6a8a646ce1ac0.png)


