


SIA Weekly: Where are US and Canadian Equities Going Now?
For this week’s SIA Equity Leaders Weekly, we are going to re-examine both the broad U.S. Equity Market via the S&P 500 Composite Index and the broad Canadian Equity Market through the S&P/TSX Composite Index. When we last looked at these at the beginning of 2016, the broad equity markets were experiencing a sharp pull back and both the S&P 500 and the S&P/TSX Composite were approaching critical support levels.
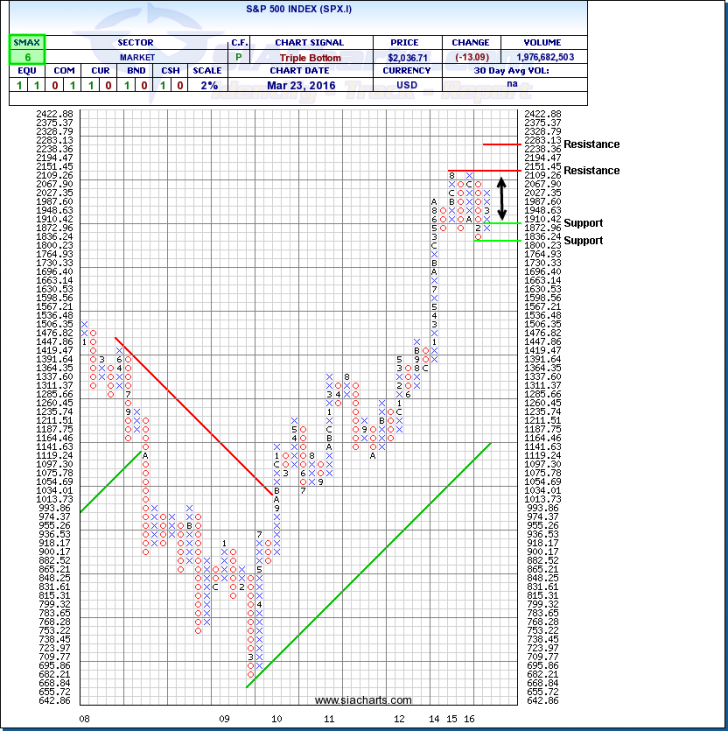
S&P 500 Index (SPX.I)
The last couple of times that we looked at the S&P 500 Index (SPX.I) we commented on it being range bound between 1,836 and 2,151, and that trend has continued into March of 2016. The S&P 500 had broken through that 1,836 support level but held at 1,800 support level and has now reversed to the upside towards 2,151 again. If the SPX.I does break through to new all-time highs, the next resistance level can be found in the 2,283 area. A reversal off the February lows at the 1,800 support level has now taken place a put the S&P 500 back into a trading range that it could expect to be until major events force the trend out of this area so it will be important to keep monitoring the USD dollar strength, price of oil, Fed rate increases, global equity markets and events, etc.
The SPX.I is approximately flat so far this year after all the movement down and up in this trading range closing at -0.36% down YTD. The Nasdaq Composite Index (NASD.I) is down a little more so far in 2015 at -4.77% YTD. For understanding on how the U.S. Equity markets compared to other asset classes, SIACharts continues to monitor the supply/demand relationship of the U.S. Equity asset class versus other asset classes through daily relative strength rather than predict a certain level of the S&P 500 as an entry or exit point because this gives you a better understanding of the opportunity cost of U.S. Equity versus other investment opportunities.
Click on Image to Enlarge
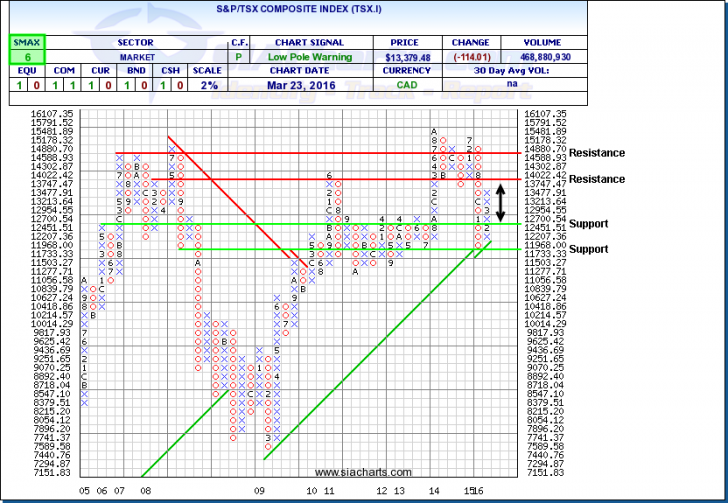
S&P/TSX Composite (TSX.I)
Unlike the major U.S. equity benchmarks, the TSX Composite (TSX.I) has also rebounded off its lows of the year but has moved to positive territory for the year up 2.86% YTD. The TSX.I held at the critical support level at 11,733 (highlighted in the last 3 charts written on the TSX.I in prior Equity Leader Weekly reports) and the upward trend line. Resistance can still also be found in the 14,000 area at 14,022, with further resistance above this at 14,880 should the strength continue. But with the weakness in Commodity prices and if the Canadian dollar starts to weaken again along with other factors, look for the continued volatility in the equity markets to increase and potentially trade in a trading range between 11,733 and 14,000.
Other news out this week affecting the Canadian economy is of a planned $29.4B federal deficit for the upcoming fiscal year. Going forward, commodity prices will continue to be important to note for guidance as to the direction of the Canadian economy. With the Commodity asset class ranked the lowest in the SIA Asset Class rankings, the Canadian sectors of energy and metals & mining could be the most affected with lots of short term reactions to price changes and in the long-term unlike other past years where the Commodity asset class has led the charge for the Canadian Equity asset class in the asset class rankings.
For a more in-depth analysis on the relative strength of the equity markets, bonds, commodities, currencies, etc. or for more information on SIACharts.com, you can contact our customer support at 1-877-668-1332 orsiateam@siacharts.com.
Click on Image to Enlarge
SIACharts.com specifically represents that it does not give investment advice or advocate the purchase or sale of any security or investment. None of the information contained in this website or document constitutes an offer to sell or the solicitation of an offer to buy any security or other investment or an offer to provide investment services of any kind. Neither SIACharts.com (FundCharts Inc.) nor its third party content providers shall be liable for any errors, inaccuracies or delays in content, or for any actions taken in reliance thereon.