When Process and Performance Disagree
by Corey Hoffstein, Newfound Research
Summary
- Due diligence often focuses on the three Ps: people, philosophy, and process.
- There is an important 4th P: performance.
- When a portfolio has a consistent process, performance can ebb and flow as the strategy goes in or out of favor. For example, value stocks have been out of favor for 8 years.
- If a strategy goes through an extended period of underperformance, we must ask whether the process is fundamentally broken or whether we have just gone through a period we would expect the process to underperform during
When we go through due diligence, the questions often focus on “the three Ps”: people, philosophy, and process.
Let’s be honest though: there is a 4th P and it’s “performance”.
The constant tug of war in asset management is between process and performance. This is particularly true for a rules-based manager.
On the one hand, as a rules-based manager you’ve been hired for your consistent process. A significant change to your rules is really tantamount to a manager change.
On the other hand, during a period of bad performance, everyone will ask: “is your process broken?”
As a portfolio manager, you’re stuck between a rock and a hard place. If you do change your process, you’ve signaled that your process is now flexible. You are no longer truly rules-based because the rules are subject to change on a whim.
If you don’t change your process, however, and performance continues to be lackluster, then you’re the stubborn mule of a manager who was too arrogant to recognize the flaw in their process.
The reality is, however, that the market often moves in waves, rewarding different investment styles at different times.
Consider, for example, the popular investment factors like “size” and “style.” Evidence suggests that investors are rewarded with excess risk-adjusted returns for allocating towards small-cap stocks over large and for value stocks over growth.
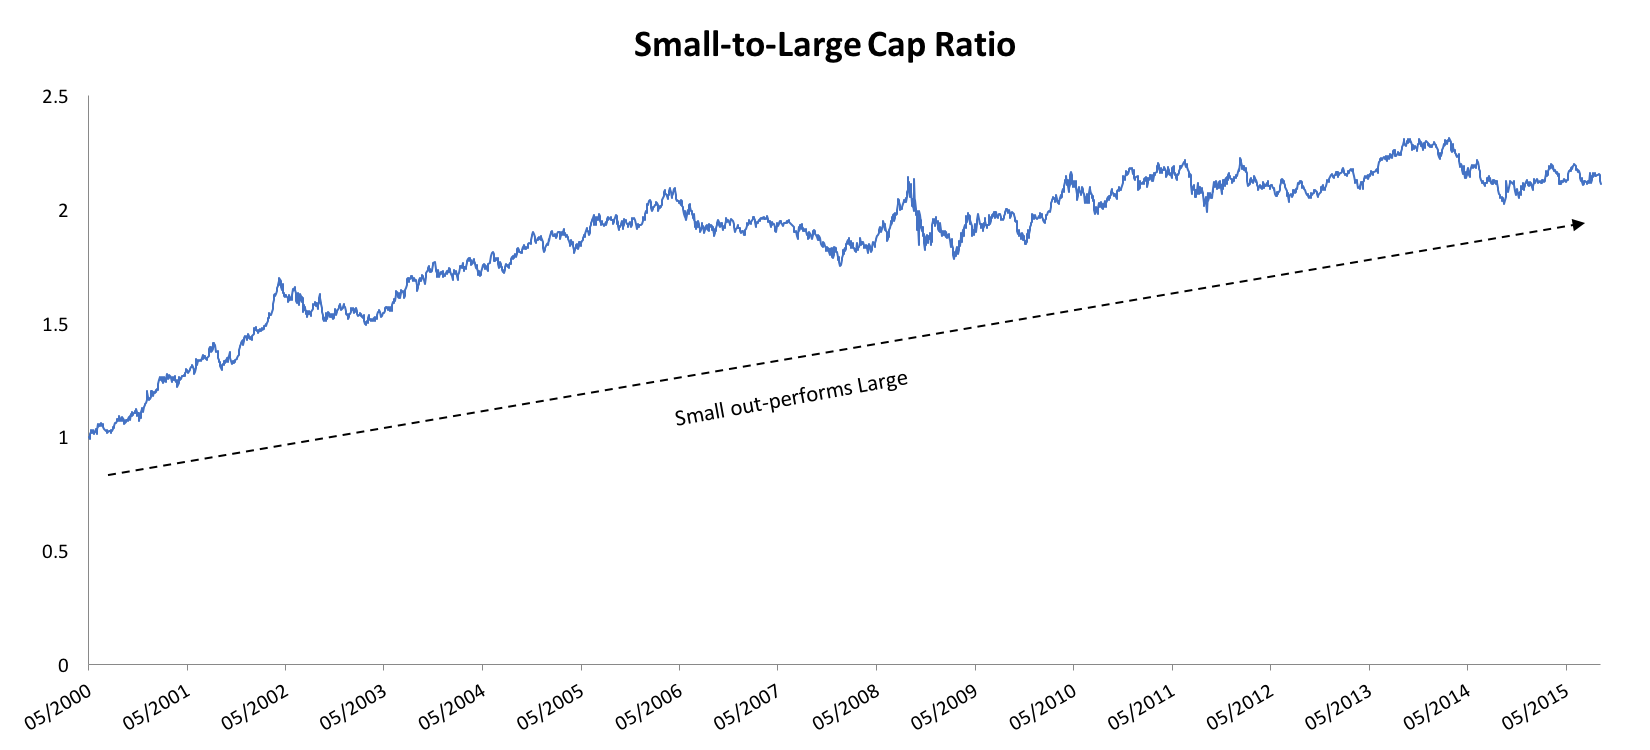
And, over a long enough horizon, this often plays out. We can see this by looking at the ratio of the S&P 600 (small-cap) versus the S&P 500 (large-cap) ETFs IJR and SPY.
Every dollar invested in small-caps 15 years ago is now worth almost 2x as much as a dollar invested in large-caps.
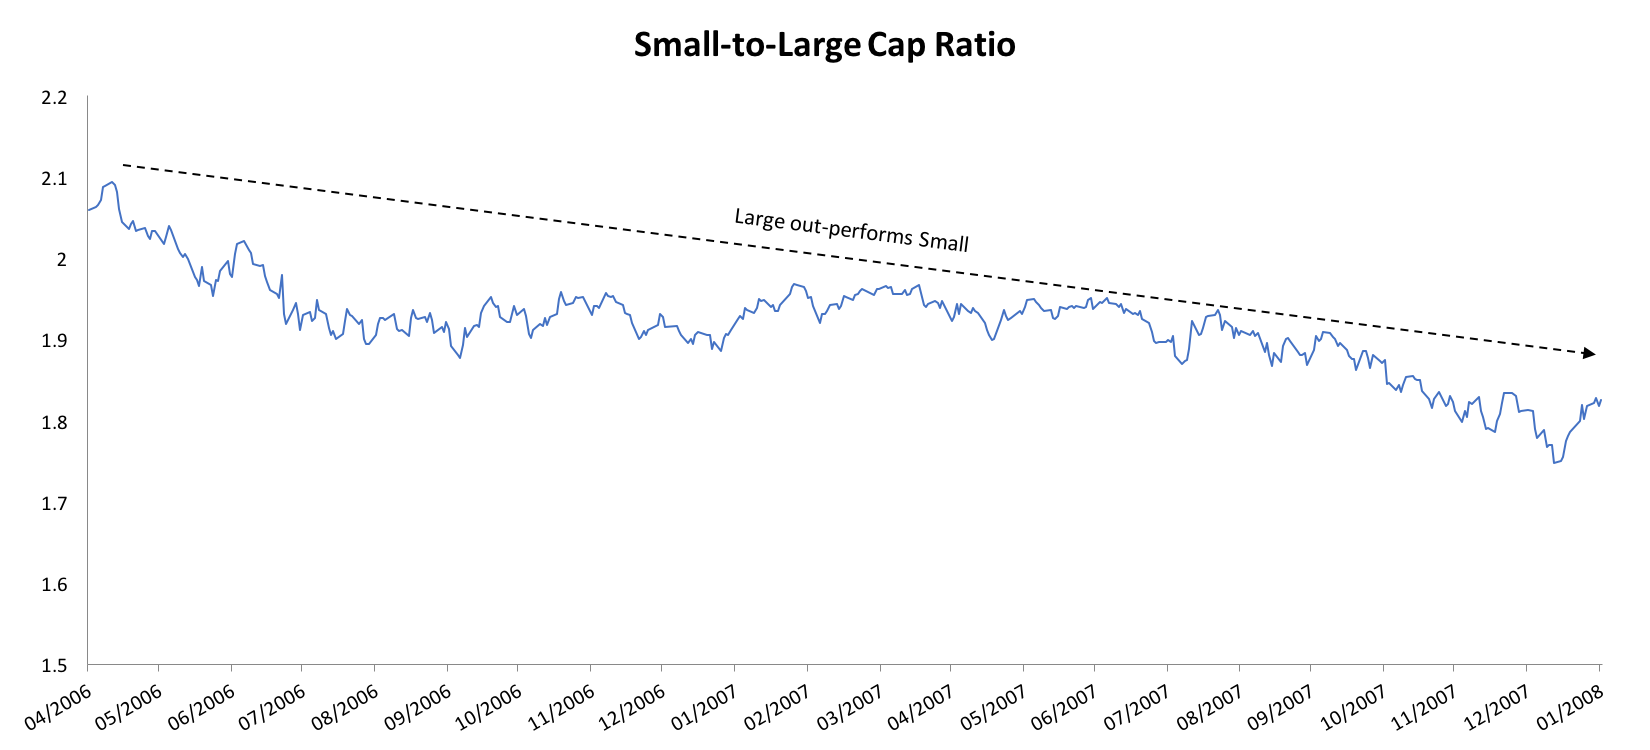
Yet there were sub-periods that may have tested an investor’s fortitude. Consider 2006 through 2008.
By January 2008, would we be asking ourselves if small-cap stocks lost their mojo? Would we ask if “this time is different?” Should we change our process?
That was a period less than two years. Can you imagine if the same underperformance went on for close to a decade?
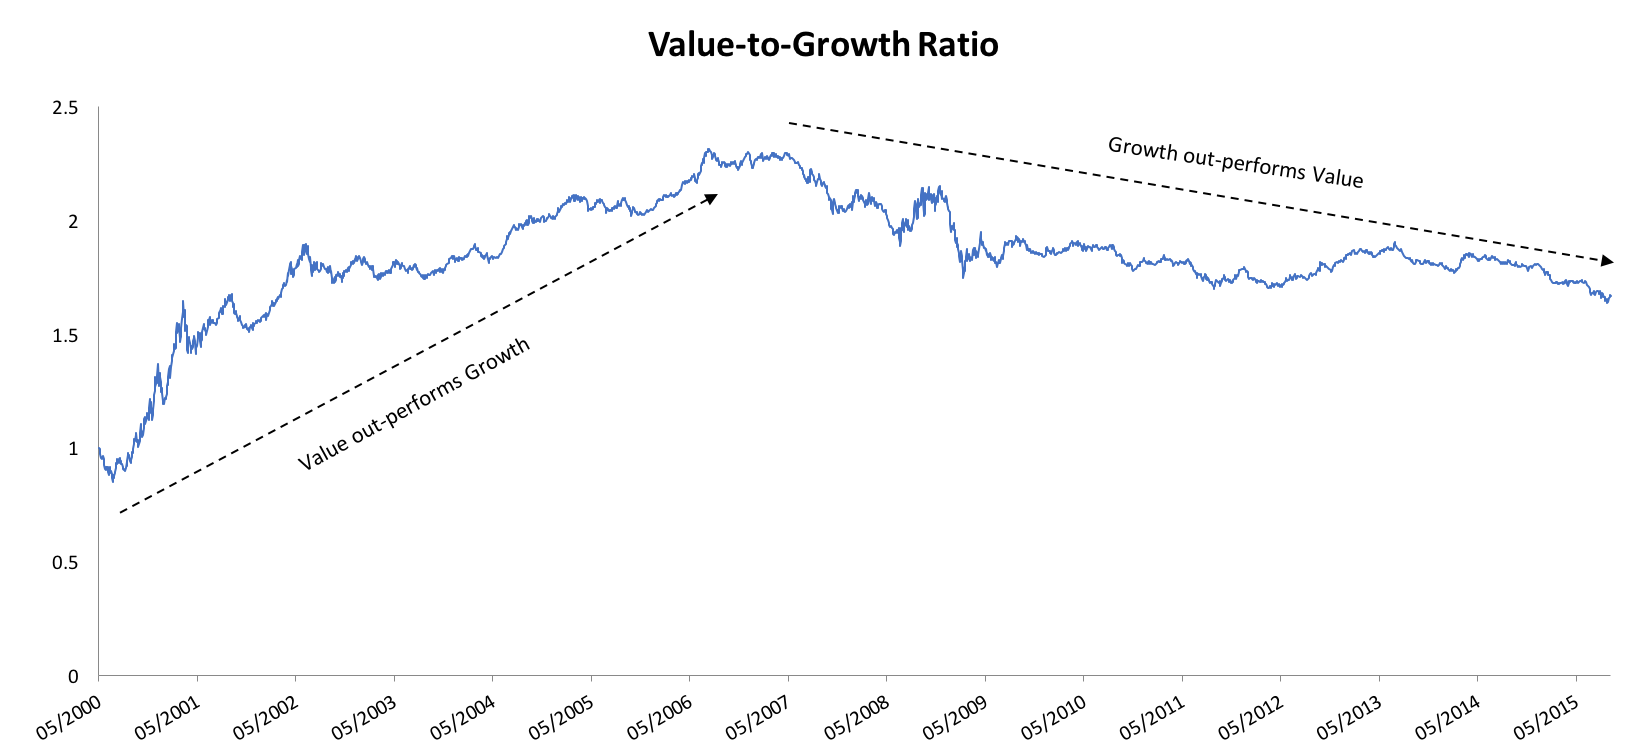
Welcome to value investing post-2007.
Since peaking on May 2nd, 2006, growth stocks have out-performed value stocks by nearly 50 percentage points. A dollar invested in value stocks is worth $1.55 today whereas a dollar invested in growth stocks is worth $2.03.
To put that in more meaningful terms, if we invested $100,000 in each, we’d have almost an extra $50,000 from investing in growth stocks.
Probably somewhat needless to say, but value managers are having a bad decade.
That’s not supposed to happen, right? Isn’t value supposed to out-perform growth? Well, we only have to rewind the clock to the late 1990s to remember that value can underperform growth for a sustained period.
The same is true for all strategies: each process has a market it thrives in and a market it struggles in.
It is easy to look at long-term historical averages and say, “I want that.” Nobody is going to look at the long-term performance of value versus the market and say, “no thanks.”
But average is not annual.
The reality is, the year-to-year often has a lot more relative volatility. Achieving that long-term relative outperformance with value means sometimes having to stick through nearly a decade of underperformance.
Trend-following is no different.
It is easy to look at how well trend following did in previous bear markets and say, “I want that.” It easy to summarize trend following in 2008 with a few numbers that distill the year-and-a-half period.
But living through the week-to-week is a totally different story.
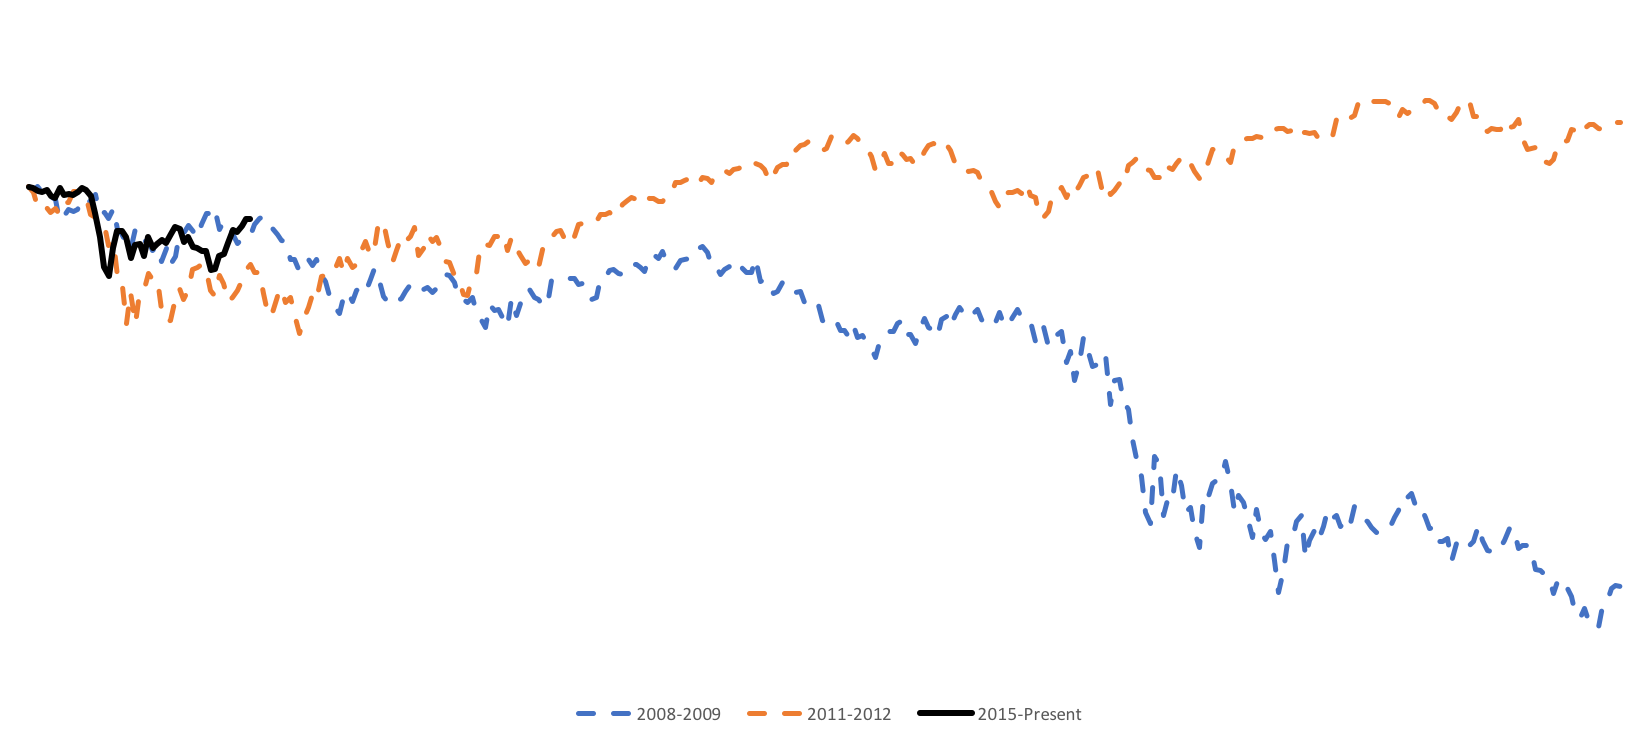
The last two weeks have been particularly difficult for trend followers, with the S&P 500 rallying just over 4.4% after a fairly negative momentum period.
We must remind ourselves, however, that high volatility cuts both ways. Bear markets often have weeks, or even months, that the market rips higher. That’s what we get with manic depressive market behavior.
In fact, this is exactly what we saw in early days in 2008. The first few months after the peak in 2007 were actually less bearish than the sell-off in 2011.
And we all know how that turned out.
That isn’t to say we’re about to see another 2008. But it serves as a reminder that we don’t want to over-react to a single week’s performance. If we want the long-term benefit, sometimes we have to grin and bear the short-term noise.
Copyright © Newfound Research


