by Don Vialoux, Timingthemarket.ca
StockTwits Released Yesterday @EquityClock
FANG stocks turning lower from resistance, weighing on the broader NASDAQ 100 Index.
Editor’s Note: FANG: Facebook Amazon.com Netflix Google
Technical action by S&P 500 stocks to 10:30 AM: Quietly bullish. Breakouts: $XRAY, $D, $CMS. No breakdowns.
Editor’s Note: After 10:30, three more utilities broke resistance: AEP, DTE and XEL
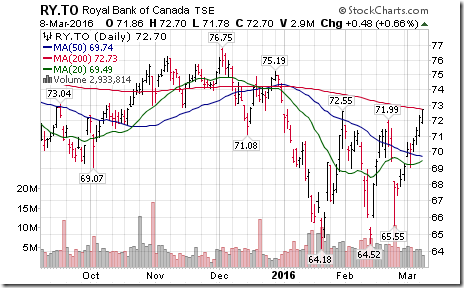
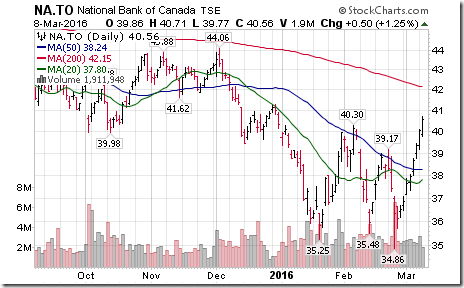
Cdn. Banks leading TSX stocks this morning. $RY.CA and $NA.CA touched new 2016 highs.
Trader’s Corner
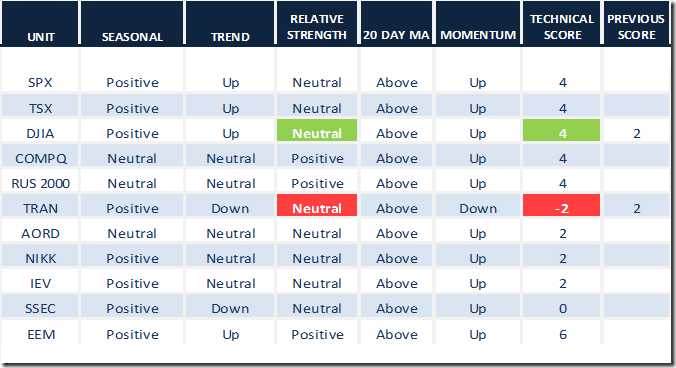
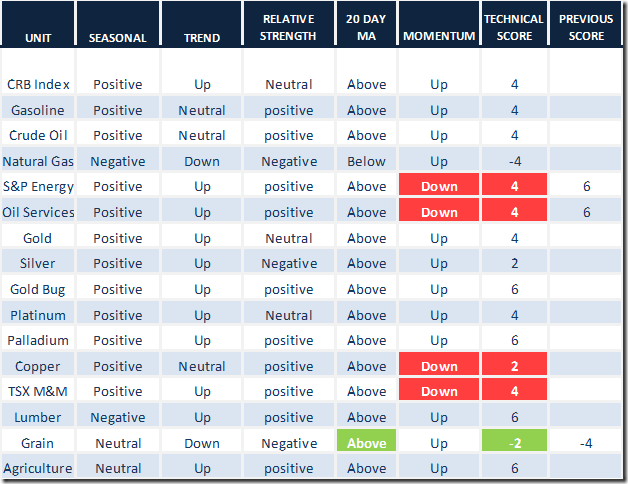
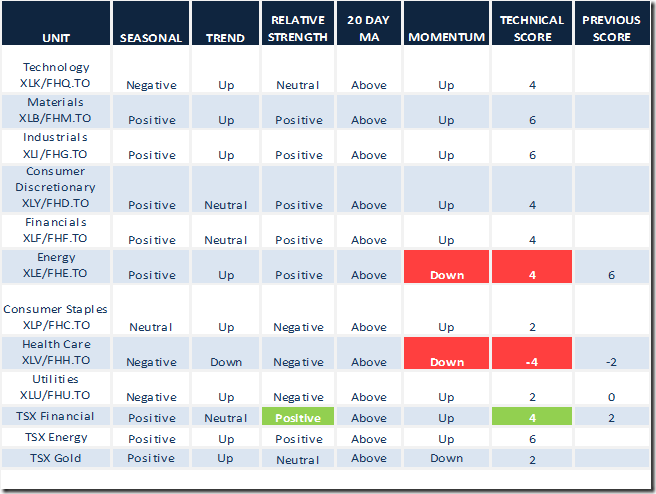
Technical scores generally moved lower when short term momentum indicators changed to Down from Up.
Daily Seasonal/Technical Equity Trends for March 8th 2016
Green: Increase from previous day
Red: Decrease from previous day
Daily Seasonal/Technical Commodities Trends for March 8th 2016
Green: Increase from previous day
Red: Decrease from previous day
Daily Seasonal/Technical Sector Trends for March 8th 2016
Green: Increase from previous day
Red: Decrease from previous day
Special Free Services available through www.equityclock.com
Equityclock.com is offering free access to a data base showing seasonal studies on individual stocks and sectors. The data base holds seasonality studies on over 1000 big and moderate cap securities and indices. To login, simply go to http://www.equityclock.com/charts/ Following is an example:
Accountability Report
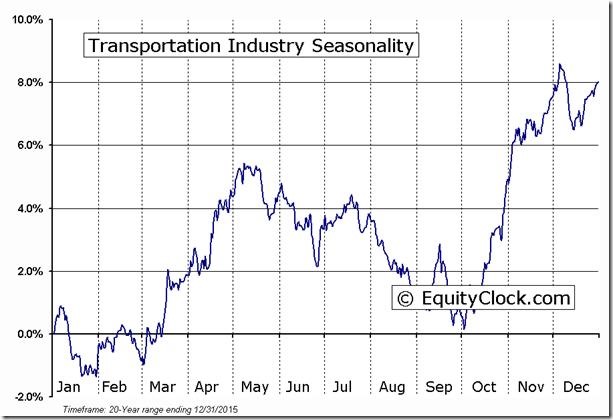
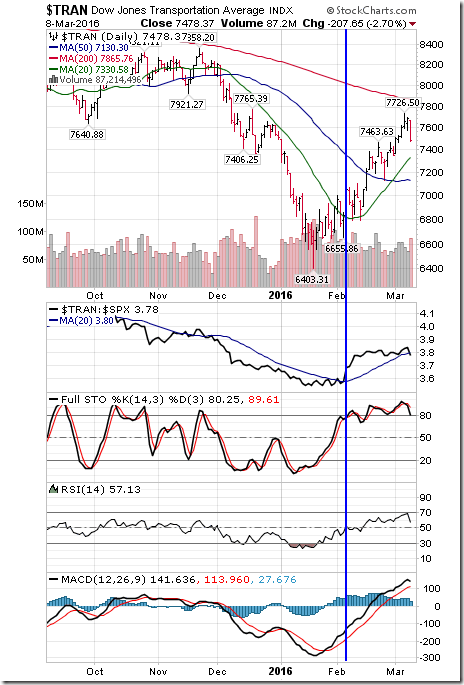
The Dow Jones Transportation Average and its related ETF (IYT) initially was noted to have a favourable technical and seasonal profile in a Tech Talk report on February 5th when the Average closed at 7,051.25. Trigger was start of a period of outperformance relative to the S&P 500 Index. Since February 5th, the Average has gained 6.1% to 7,478.37. Now, the Average no longer is outperforming the S&P 500 Index and its short term momentum indicators have started to turn down from overbought levels. Short term traders can take profits. Seasonal influences remain positive until mid-May. Possibility of returning to the trade before mid-May exists.
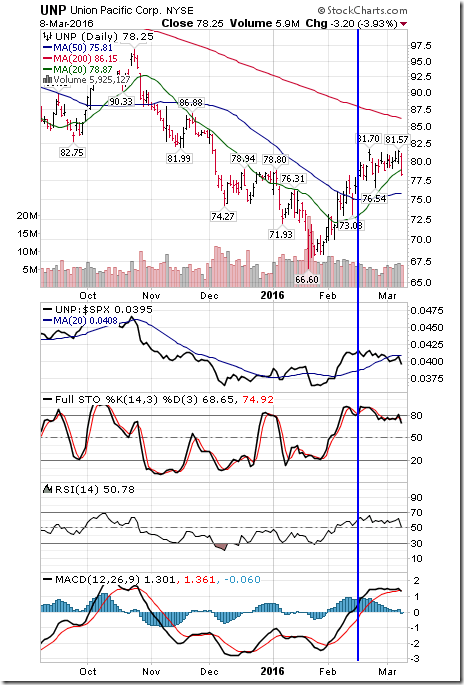
February 17th edition of Tech Talk offered favourable seasonality and price charts on Union Pacific at $79.37 after the stock moved above resistance at $78.94. Yesterday, the stock closed at $78.25 for a decline since February 17th of 1.4%. Technicals are turning negative: Dropped below its 20 day moving average, short term momentum indicators are trending down, strength relative to the S&P 500 Index has turned negative. Short term traders can liquidate at a small loss.
Disclaimer: Seasonality and technical ratings offered in this report by www.timingthemarket.ca and www.equityclock.com are for information only. They should not be considered as advice to purchase or to sell mentioned securities. Data offered in this report is believed to be accurate, but is not guaranteed
Copyright © DV Tech Talk, Timingthemarket.ca


