by Don Vialoux, Timingthemarket.ca
Economic News This Week
February Canadian Housing Starts to be released at 8:15 AM EST on Monday are expected to increase to 180,000 from 165,861 in January.
Bank of Canada Policy Announcement is scheduled to be released at 10:00 AM EST on Wednesday. No change in the Overnight Lending Rate is expected.
January Wholesale Inventories to be released at 10:00 AM EST on Wednesday is expected to drop 0.2% versus a decline of 0.1% in December.
Weekly Initial Jobless Claims to be released at 8:30 AM EST on Thursday are expected to slip to 275,000 from 278,000.
Canada’s February Employment Report to be released at 8:30 AM EST on Friday is expected to increase 10,000, up from a decline of 5,700 in January. Canada’s February Unemployment Rate is expected to be unchanged from January at 7.2%.
Earnings Reports This Week
Monday: Urban Outfitters
Wednesday: Crescent Point Energy, Linamar
Thursday: Detour Gold
StockTwits Released on Friday
S&P 500 testing upper limit of rising wedge pattern as complacency hits highest level since mid-December.
Technicals for S&P 500 stocks to 10:30: Bullish. $SNI, $COP, $MRO, $NBL, $RRC $PNC, $WFC, $EMR, $GLW, $TDC, $EMC, $PX. Breakdown: $HRB
Editor’s Note: After 10:30, another S&P 500 stocks broke resistance including another 4 energy stocks (APC, NOV, CHK and XEC)
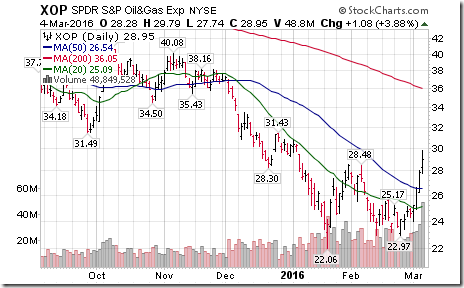
Energy stocks and ETFs lead the list of S&P 500 stocks lead the list of breakouts: $$COP, $MRO, $NBL, $RRC, $XOP
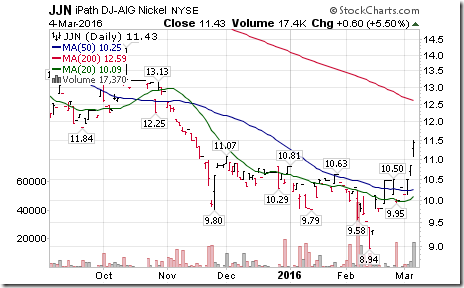
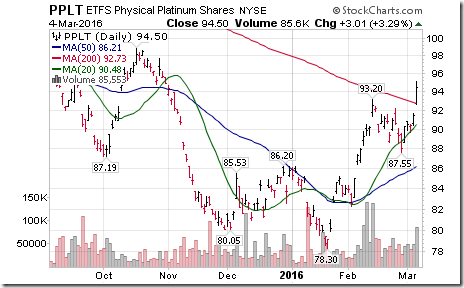
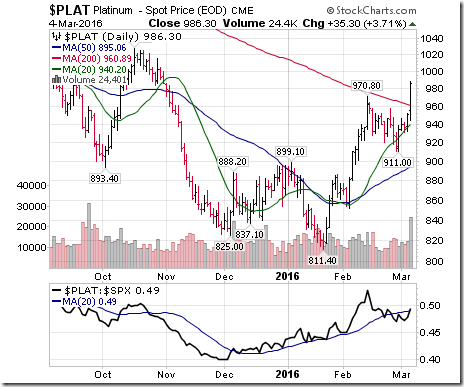
Weakness in the U.S. Dollar Index has prompted breakout by Platinum $PPLT and Nickel $JJN.
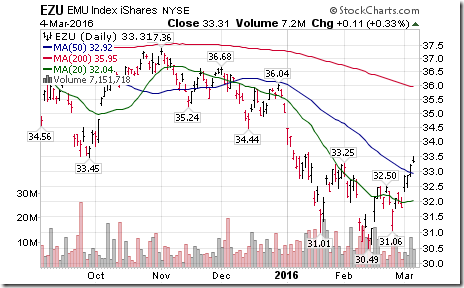
Nice breakout above $33.25 by iShares Europe Monetary Union ETF $EZU to complete a double bottom pattern.
The Bottom Line
The current intermediate uptrend is short term overbought. From lows set on January 21st, the Dow Jones Industrial Average has gained 10.1%, the S&P 500 Index has added 10.4% and the TSX Composite Index has advanced 14.6%. Prudent strategy is to hold short term trading positions with a view to taking profits when short term technical indicators roll over and to add to investment positions on weakness. Economically sensitive sectors with positive seasonal influences are preferred (e.g. Materials, Industrials, Consumer Discretionary and Energy in the U.S. as well as Base Metals, Energy and Financials in Canada). Outside of North America, European and Emerging Market ETFs also are attractive.
Equity Indices and Related ETFs
Daily Seasonal/Technical Equity Trends for March 4th 2016
Green: Increase from previous day
Red: Decrease from previous day
Calculating Technical Scores
Technical scores are calculated as follows:
Intermediate Uptrend based on at least 20 trading days: Score 2
Higher highs and higher lows
Intermediate Neutral trend: Score 0
Not up or down
Intermediate Downtrend: Score -2
Lower highs and lower lows
Outperformance relative to the S&P 500 Index: Score: 2
Neutral Performance relative to the S&P 500 Index: 0
Underperformance relative to the S&P 500 Index: Score –2
Above 20 day moving average: Score 1
At 20 day moving average: Score: 0
Below 20 day moving average: –1
Up trending momentum indicators (Daily Stochastics, RSI and MACD): 1
Mixed momentum indicators: 0
Down trending momentum indicators: –1
Technical scores range from -6 to +6. Technical buy signals based on the above guidelines start when a security advances to at least 0.0, but preferably 2.0 or higher. Technical sell/short signals start when a security descends to 0, but preferably -2.0 or lower.
Long positions require maintaining a technical score of -2.0 or higher. Conversely, a short position requires maintaining a technical score of +2.0 or lower.
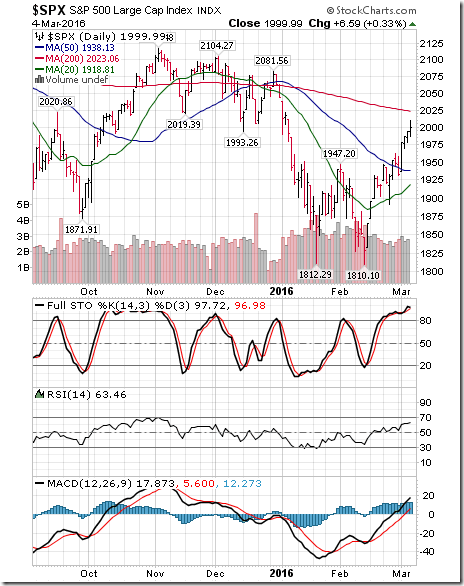
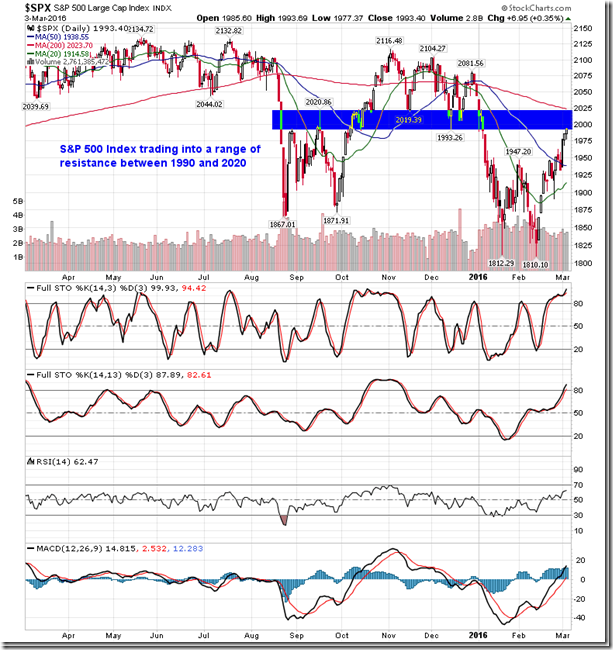
The S&P 500 Index gained 51.94 points (2.67%) last week. Intermediate trend remains up. The Index remains above its 20 day moving average. Short term momentum indicators are trending up, but are overbought.
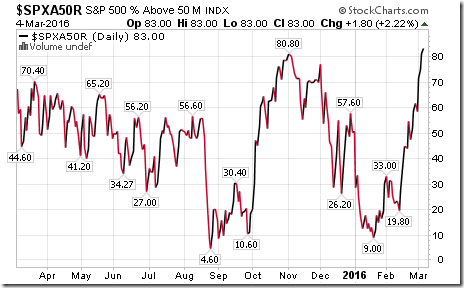
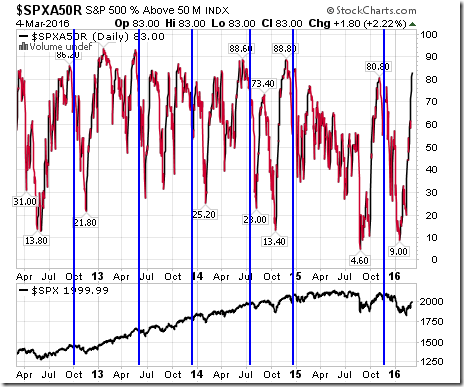
Percent of S&P 500 stocks trading above their 50 day moving average rose last week to 83.00% from 61.60%. Percent remains in an intermediate uptrend and is overbought, but signs of a peak have yet to appear.
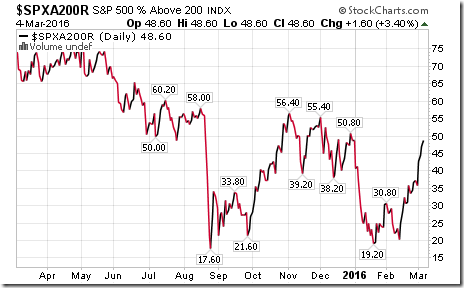
Percent of S&P 500 stocks trading above their 200 day moving average increased last week to 48.60% from 37.20%. Percent remains in an intermediate uptrend.
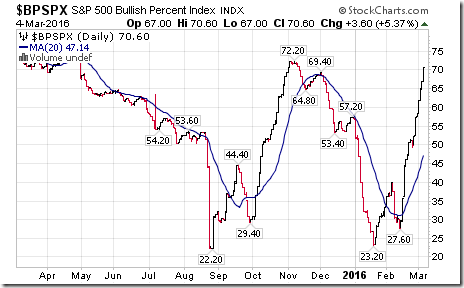
Bullish Percent Index for S&P 500 stocks increased last week to 70.60% from 57.40% and remained above its 20 day moving average. The Index remains in an intermediate uptrend and is overbought. However, signs of an intermediate peak have yet to arrive.
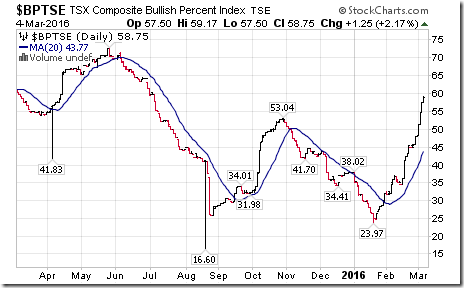
Bullish Percent Index for TSX stocks increased last week to 58.75% from 47.92% and remained above its 20 day moving average. The Index remains in an intermediate uptrend and is overbought.
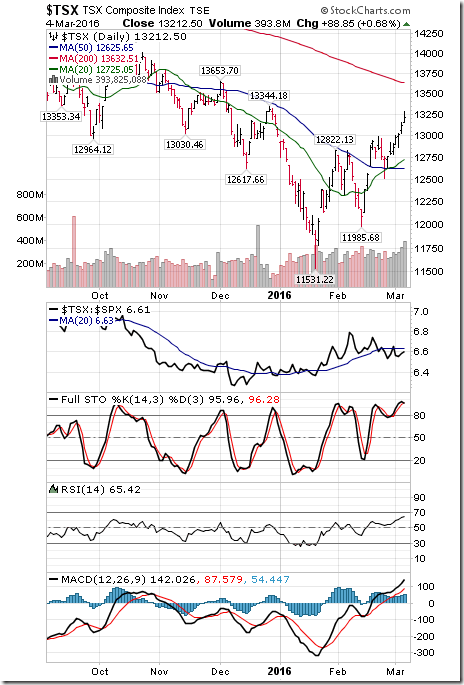
The TSX Composite Index jumped 414.05 points (3.24%) last week. Intermediate trend remains up (Score: 2). Strength relative to the S&P 500 Index remained Negative (Score:-2). The Index remained above its 20 day moving average (Score: 1). Short term momentum indicators are trending up (Score: 1), but are overbought. Technical score remained unchanged last week at 2.
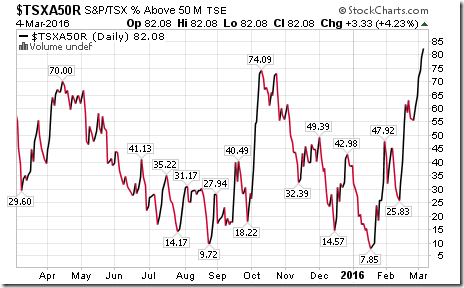
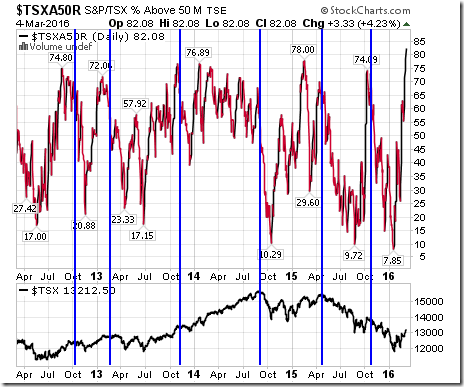
Percent of TSX stocks trading above their 50 day moving average jumped to 82.08% from 60.83%. Percent remains in an intermediate uptrend and is overbought. However, signs of a peak have yet to appear.
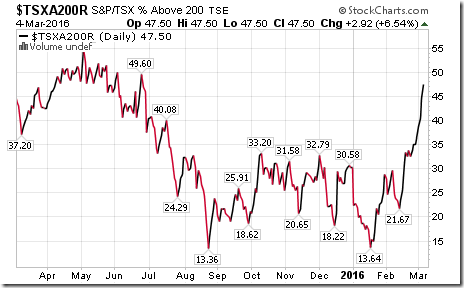
Percent of TSX stocks trading above their 200 day moving average jumped to 47.50% from 35.00%. Percent remains in an intermediate uptrend.
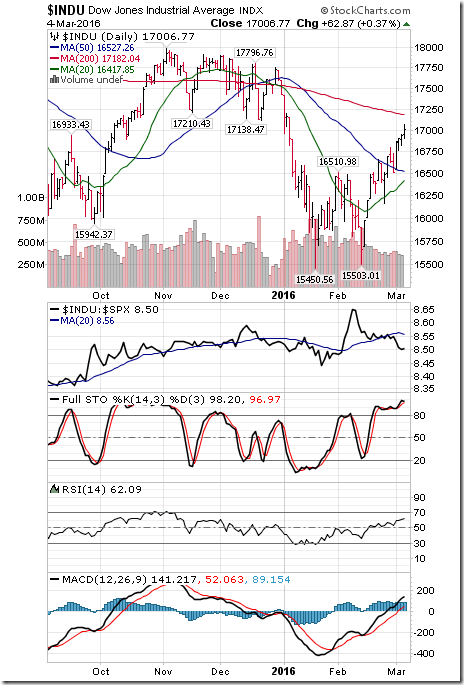
The Dow Jones Industrial Average gained 366.80 points (2.20%) last week. Intermediate trend remains up. Strength relative to the S&P 500 Index changed to Negative from Neutral. The Average remains above its 20 day moving average. Short term momentum indicators are trending up. Technical score dropped last week to 2 from 4.
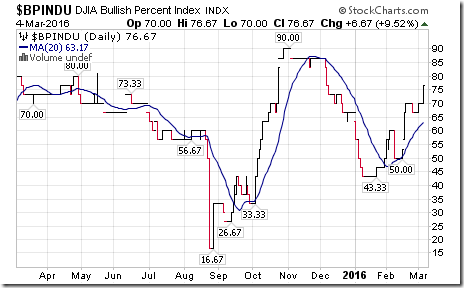
Bullish Percent Index for Dow Jones Industrial Average stocks increased last week to 76.67% from 66.67% and remained above its 20 day moving average. The Index remains in an intermediate uptrend.
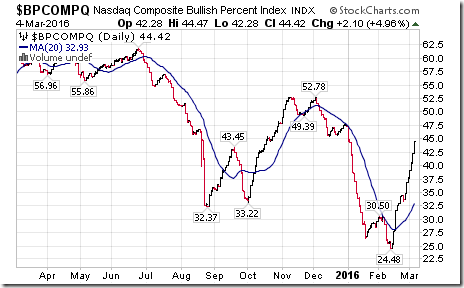
Bullish Percent Index for NASDAQ Composite stocks increased last week to 44.42% from 36.80% and remained above its 20 day moving average. The Index remains in an intermediate uptrend.
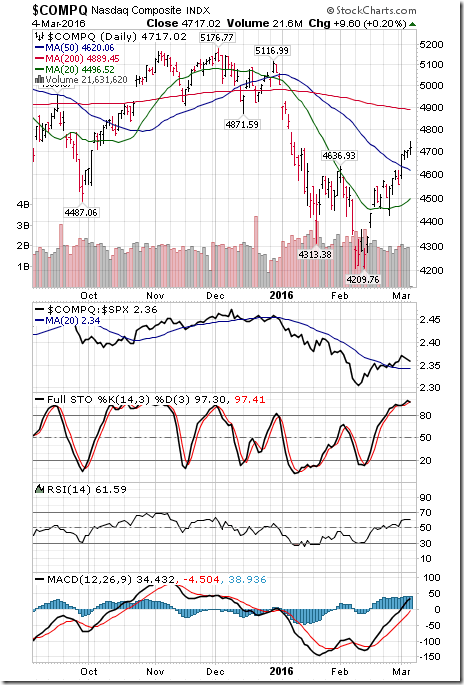
The NASDAQ Composite Index gained 126.55 points (2.76%) last week. Intermediate trend changed to Neutral from Down on a move above 4,636.93. Strength relative to the S&P 500 changed to Positive from Neutral. The Index remains above its 20 day moving average. Short term momentum indicators are trending up. Technical score improved last week to 4 from 0.
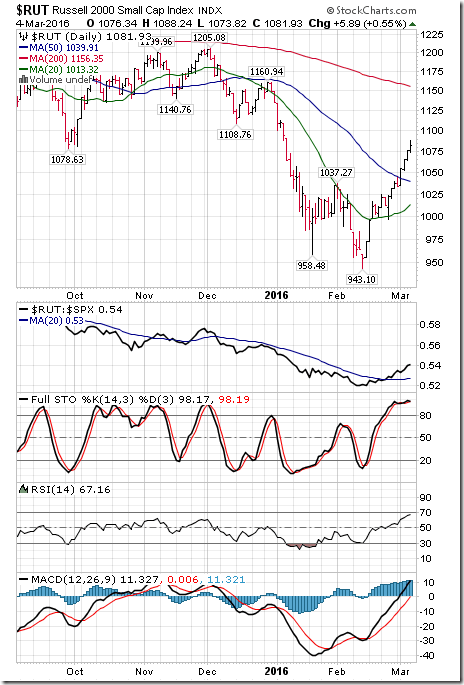
The Russell 2000 Index added 44.75 points (4.31%) last week. Intermediate trend remained Neutral. Strength relative to the S&P 500 Index remained Positive. The Index remains above its 20 day moving average. Short term momentum indicators are trending up, but are overbought. Technical score remained at 4.
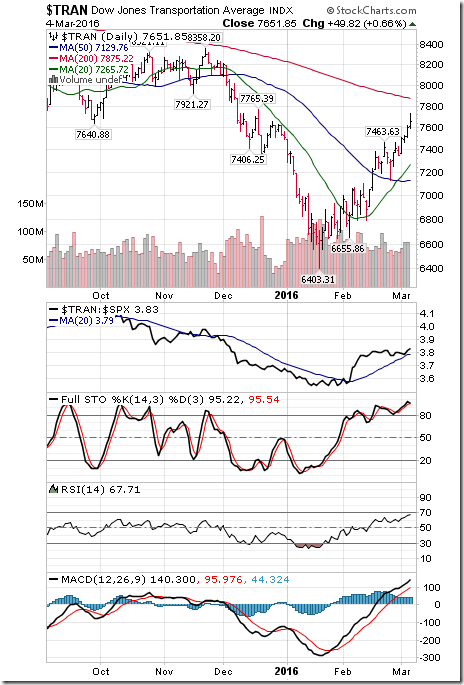
The Dow Jones Transportation Average added 246.82 points (3.33%) last week. Intermediate trend remains down. Strength relative to the S&P 500 Index remained Positive. The Average remains above its 20 day moving average. Short term momentum indicators are trending up, but are overbought. Technical score remained last week at 2.
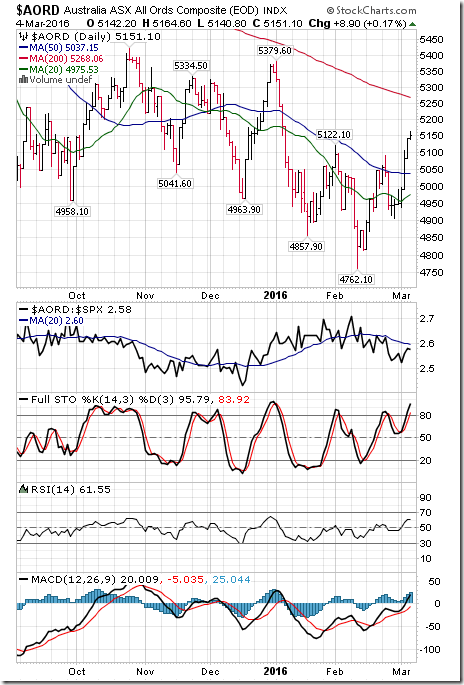
The Australia All Ordinaries Composite Index gained 206.00 points (4.17%) last week. Intermediate trend changed to Neutral from Down. Strength relative to the S&P 500 Index improved to Neutral from Negative. The Index moved above its 20 day moving average. Short term momentum indicators are trending up. Technical score improved last week to 2 from -6.
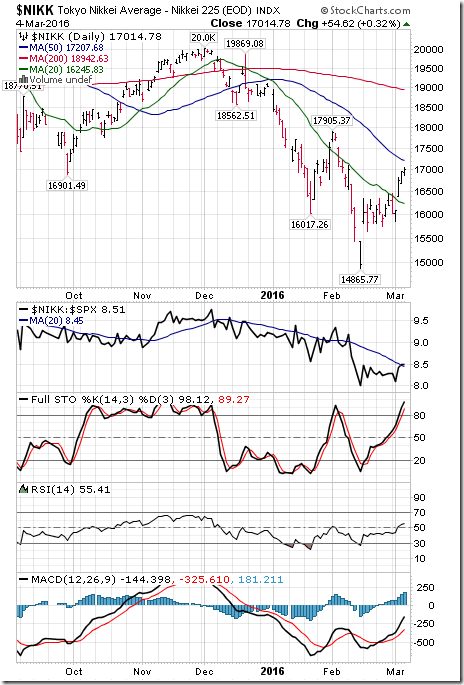
The Nikkei Average jumped 826.37 points (5.10%) last week. Intermediate trend remained down. Strength relative to the S&P 500 Index changed to Neutral from Negative. The Average moved above its 20 day moving average. Short term momentum indicators are trending up, but are overbought. Technical score improved last week to 2 from -4.
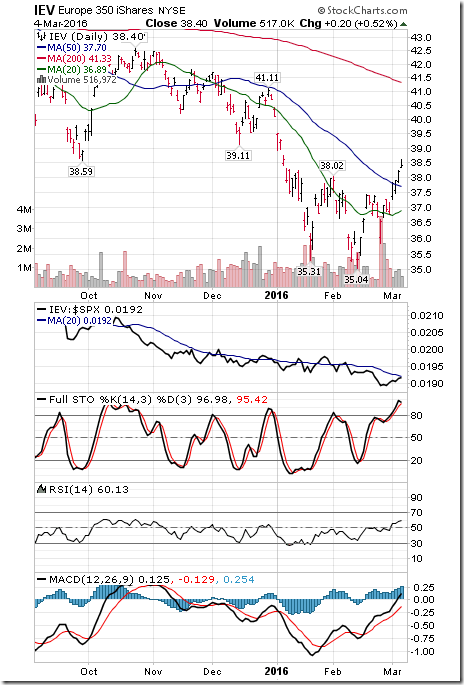
iShares Europe gained $1.45 (3.86%) last week. Intermediate trend changed to Neutral from Down. Strength relative to the S&P 500 Index changed to Neutral from Negative. Units remain above their 20 day moving average. Short term momentum indicators are trending up, but are overbought.
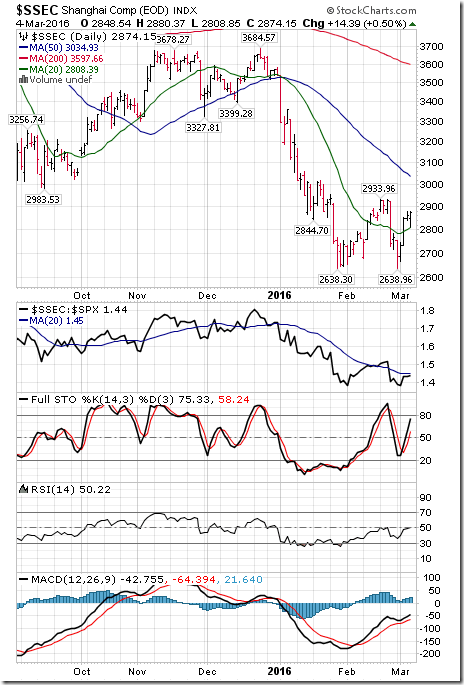
The Shanghai Composite Index added 106.94 points (3.86%) last week. Intermediate trend remains down. Strength relative to the S&P 500 Index remained Negative. The Index moved above its 20 day moving average. Short term momentum indicators are trending up. Technical score improved last week to -2 from -6.
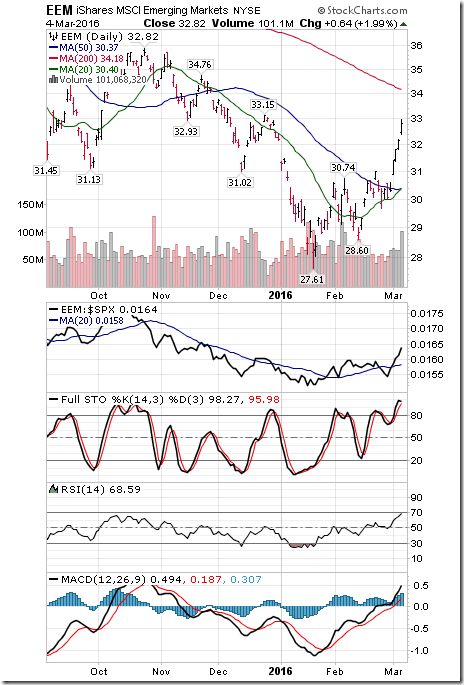
Emerging Markets iShares jumped $2.76 (9.18%) last week. Intermediate trend remained up. Strength relative to the S&P 500 Index changed to Positive from Negative. Units remained above their 20 day moving average. Short term momentum indicators are trending up, but are overbought. Technical score improved to 6 from 0.
Currencies
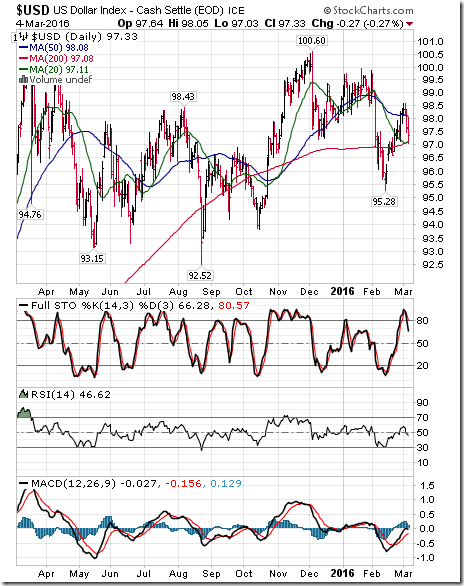
The U.S. Dollar Index dropped 0.77 (0.78%) last week. Intermediate trend remains down. The Index dropped below its 20 day moving average. Short term momentum indicators have just rolled over and are trending down.
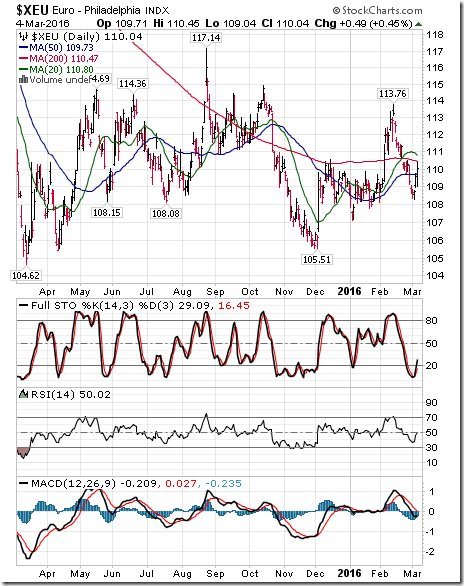
The Euro added 0.67 (0.61%) last week. Intermediate trend remains up. The Euro remains below its 20 day moving average. Short term momentum indicators are oversold and have started to trend up.
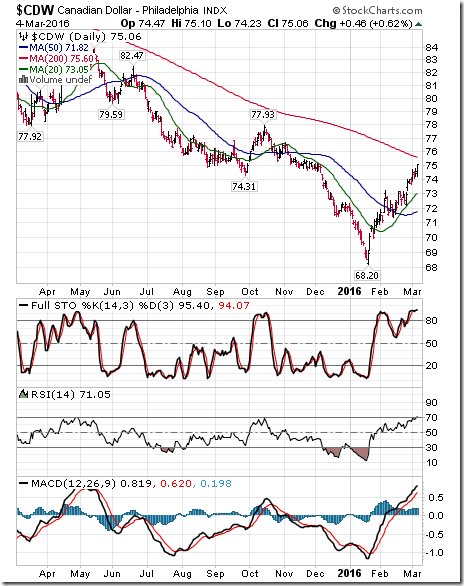
The Canadian Dollar gained another US 1.09 cents (1.47%) last week. Intermediate trend remains up. The Canuck Buck remains above its 20 day moving average. Short term momentum indicators are trending up, but are overbought.
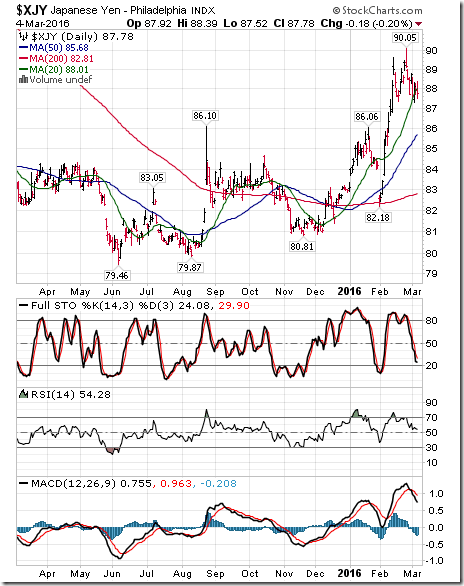
The Japanese Yen added 0.03 (0.03%) last week. Intermediate trend remains up. The Yen dropped below its 20 day moving average on Friday. Short term momentum indicators are trending down.
Commodities
Daily Seasonal/Technical Commodities Trends for March 4th 2016
Green: Increase from previous day
Red: Decrease from previous day
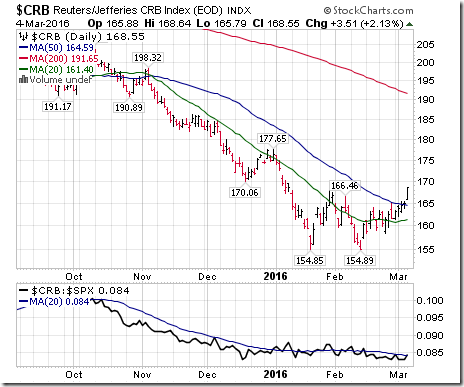
The CRB Index gained 6.88 points (4.26%) last week. Intermediate trend changed to Up from Down on a move on Friday above 166.46. Strength relative to the S&P 500 Index changed to Neutral from Negative. The Index remained above its 20 day moving average. Short term momentum indicators are trending up. Technical score improved last week to 4 from -2.
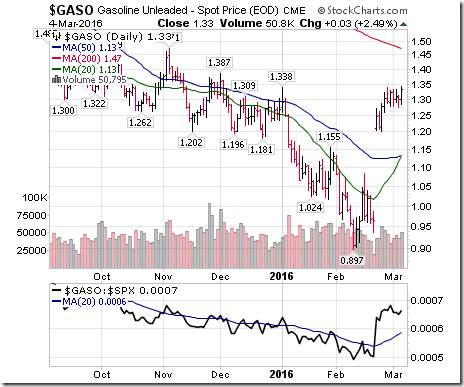
Gasoline gained $0.03 per gallon (2.31%) last week. Intermediate trend remains down. Strength relative to the S&P 500 Index remains positive. Gas remains above its 20 day moving average. Short term momentum indicators are trending up. Technical score remained last week at 2
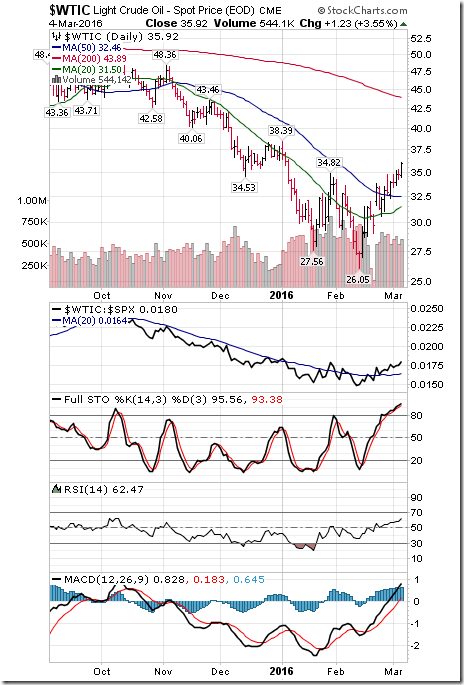
Crude Oil gained another $3.14 per barrel (9.58%) last week. Intermediate trend changed to Neutral on a move above$34.82. Strength relative to the S&P 500 Index remained Positive. Crude remained above its 20 day moving average. Short term momentum indicators are trending up, but are overbought. Technical score improved last week to 4 from 2.
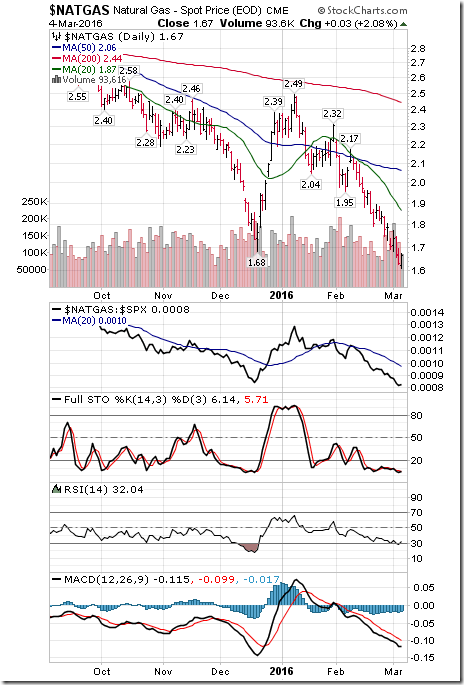
Natural Gas dropped another $0.12 per MBtu (6.70%) last week. Intermediate trend remains down. Strength relative to the S&P 500 Index remains Negative. “Natty” remains below its 20 day moving average. Short term momentum indicators are trending down, but are oversold. Technical score remained at -6.
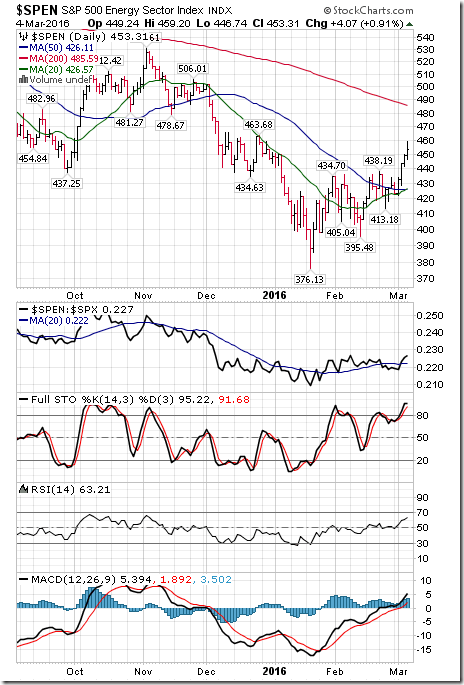
The S&P Energy Index added another 24.82 points (5.79%) last week. Intermediate trend remained up. Strength relative to the S&P 500 Index changed to Positive from Neutral. The Index remained above its 20 day moving average. Short term momentum indicators are trending up, but are overbought. Technical score improved last week to 6 from 4.
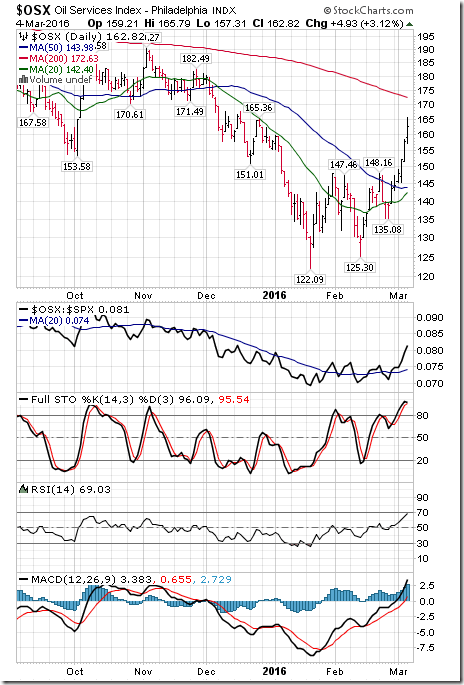
The Philadelphia Oil Services Index jumped 19.19 points (13.36%) last week. Intermediate trend remained up. Strength relative to the S&P 500 Index changed to Positive from Neutral. The Index remains above its 20 day moving average. Short term momentum indicators are trending up, but are overbought. Technical score improved last week to 6 from 4.
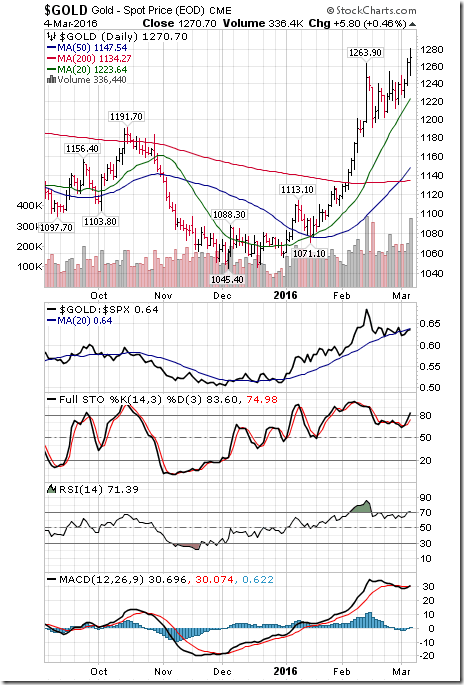
Gold gained $50.30 per ounce (4.12%) last week. Gold extended its intermediate uptrend on Friday on a move above $1,263.90. Strength relative to the S&P 500 Index remained Neutral. Gold remained above its 20 day moving average. Short term momentum indicators are trending up. Technical score improved last week to 4 from 2.
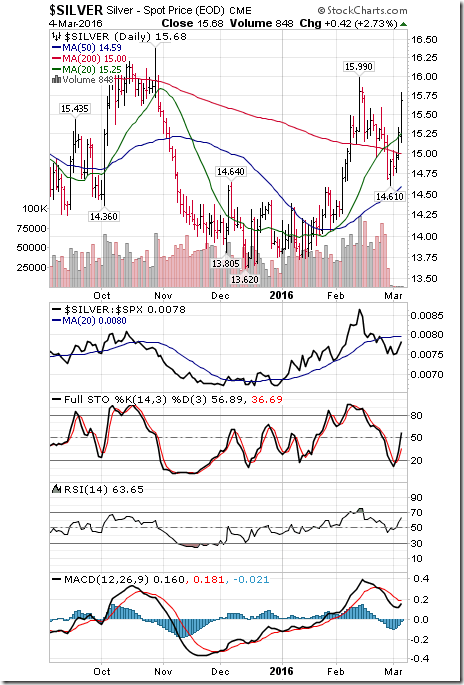
Silver gained $0.99 per ounce (6.74%) last week. Intermediate trend remains up. Strength relative to the S&P 500 Index remains Negative. Silver moved back above its 20 day moving average on Friday. Short term momentum indicators are trending up. Technical score improved last week to 2 from -2.
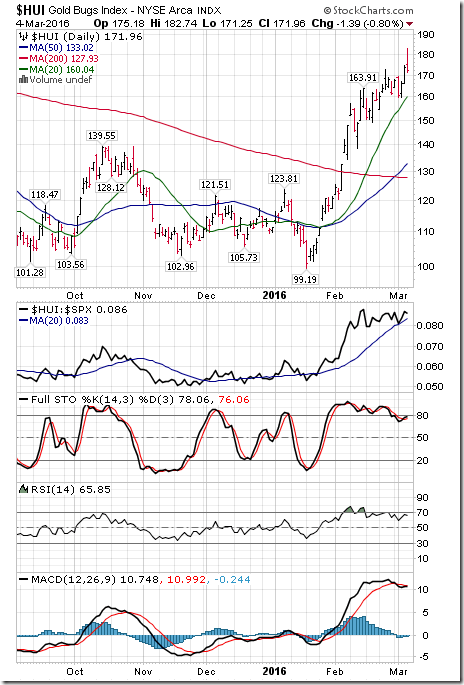
The AMEX Gold Bug Index gained 9.85 points (6.08%) last week. Intermediate trend remains up. Strength relative to the S&P 500 Index remained Neutral. The Index remained above its 20 day moving average. Short term momentum indicators are trending up, but are overbought and showing early signs of rolling over. Technical score improved last week to 4 from 2.
Platinum jumped $71.20 (7.78%) last week. Trend changed on Friday to Up from Neutral on a move above $970.80 per ounce. Strength: Neutral. Moved above its 20 day moving average.
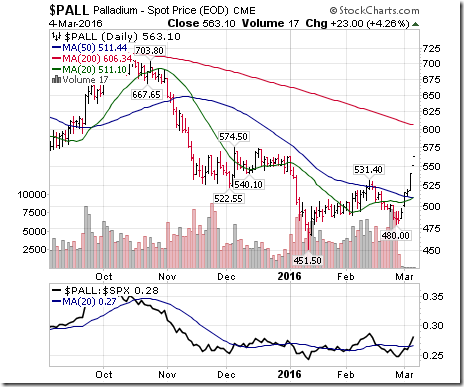
Palladium jumped $81.00 per ounce (16.80%) last week. Intermediate trend changed to up from down on a move above $531.40. Strength relative to the S&P 500 turned Positive from Neutral. PALL moved above its 20 day moving average. Short term momentum has turned up.
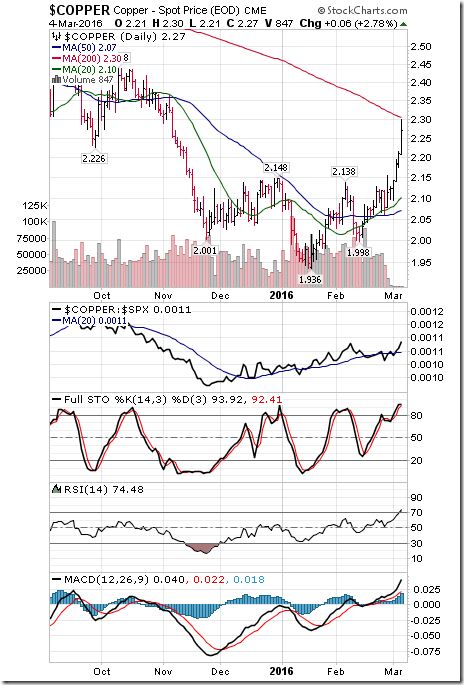
Copper jumped $0.15 per lb. (7.08%) last week. Intermediate trend changed to Neutral from Down on a move above $2.148. Strength relative to the S&P 500 Index turned Positive. Copper remained above its 20 day moving average. Short term momentum indicators are trending up. Technical score improved last week to 4 from -2.
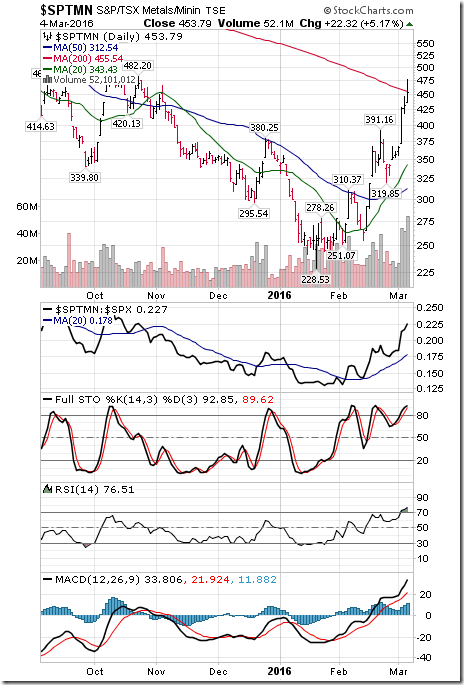
The S&P Metals & Mining Index jumped 100.98 points (28.62%) last week. Intermediate trend remains up. Strength relative to the S&P 500 Index remains Positive. The Index remains above its 20 day moving average. Short term momentum indicators are trending up, but are overbought. Technical score improved last week to 6 from 4.
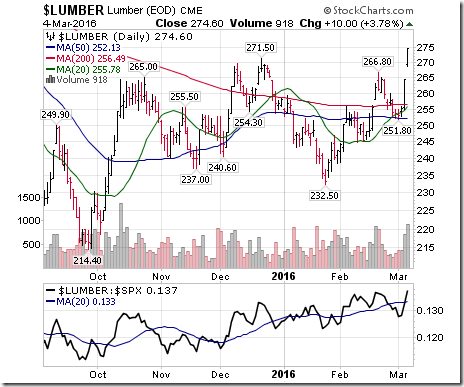
Lumber jumped $21.60 (8.54%) last week. Trend turned Positive on Friday on a move above $271.50. Relative strength turned Positive. Momentum has turned Positive. Score: 6
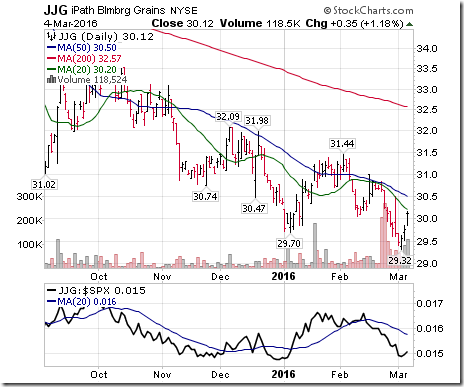
The Grain ETN added $0.33 91.11%) last week. Intermediate trend remains down. Strength relative to the S&P 500 Index remains negative. Units remain below their 20 day moving average. Short term momentum indicators have started to trend up. Score: -4
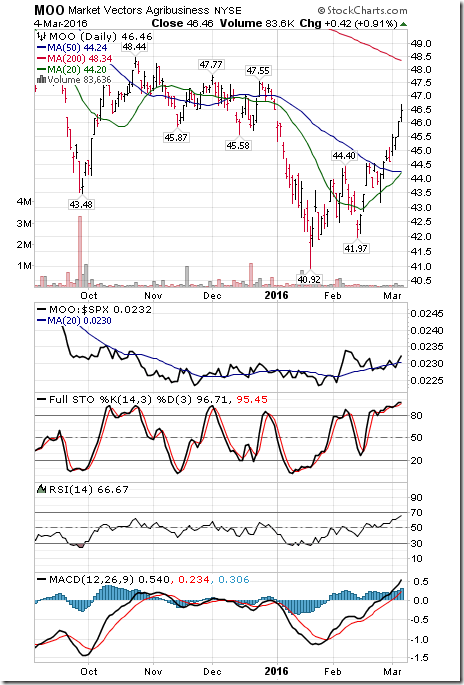
The Agriculture ETF gained $1.76 (3.94%) last week. Intermediate trend remains up. Strength relative to the S&P 500 Index turned Positive. Units remain above their 20 day moving average. Short term momentum indicators are trending up, but are overbought. Technical score improved last week to 6 from 4.
Interest Rates
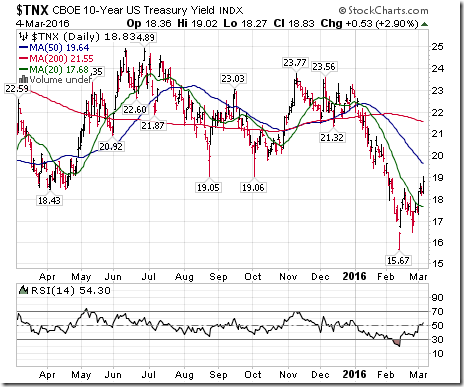
Yield on 10 year U.S. Treasuries gained 12.1 basis points (6.87%) last week. Intermediate trend remains down. Yield moved above its 20 day moving average. Short term momentum indicators are trending up.
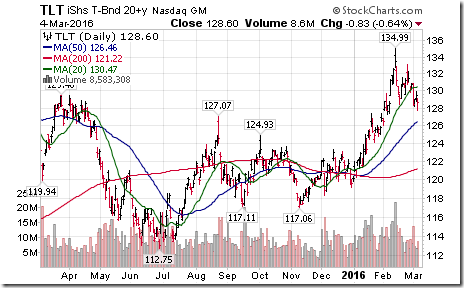
Conversely, price of the long term Treasury ETF dropped $1.81 (1.59%) last week. Price fell below its 20 day moving average. Short term momentum indicators are trending down.
Other Issues
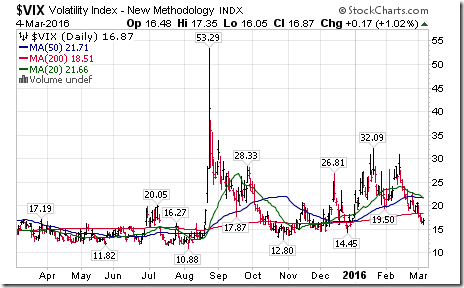
The VIX Index dropped another 2.85 (14.45%) last week. Intermediate trend remains down. The Index remains below its 20 day moving average. Short term momentum indicators are trending down and are oversold.
Economic and international focus this week is on news from the European Central Bank on Thursday that is expected to bolster monetary stimulus.
Earnings news this week is not expected to have a significant impact on North American equity markets. Only two S&P 500 companies are scheduled to report.
Consensus earnings estimates for S&P 500 companies continue to decline. According to FactSet, earnings per share on a year-over-year basis are expected to decline 8.0% versus a decline of 7.4% reported in last week’s report. Going forward, second quarter earnings are expected to decline 2.0%, but third quarter earnings are expected to increase 4.3% and fourth quarter earnings are expected to increase 9.1%. Revenues are expected to be down 0.6% in the first quarter, down 0.5% in the second quarter, up 2.1% in the third quarter and up 4.7% in the fourth quarter.
Short and intermediate technical indicators are overbought, but have yet to show significant signs of peaking. For example, Percent of S&P 500 stocks trading above their 50 day moving average moved above 80% last week. Historically, a return by Percent to below the 80% level has triggered at least a short term correction.
Ditto for TSX stocks trading above their 50 day moving average when Percent drops below 70%! Notice that many of the turn points in both charts occur approximately the same time.
As noted in EquityClock on Friday, the S&P 500 Index faces considerable intermediate overhead resistance at a time when short term momentum indicators are overbought. Upside potential remains, but likely will be “tough slugging”
The focus next week is on the FOMC Meeting on March 15th and 16th. Consensus currently is anticipating no change in the Fed Fund rate.
Seasonal influences are positive for most equity markets and economic sensitive sectors between now and mid-May. Strength was most notable last week in equity markets outside of North America.
Technical action by S&P 500 stocks remained bullish last week: 77 stocks broke resistance and 10 stocks broke support. Almost all stocks breaking support were Utilities stocks.
Sectors
Daily Seasonal/Technical Sector Trends for March 4th 2016
Green: Increase from previous day
Red: Decrease from previous day
Accountability Report Update
At the beginning of last week, Tech Talk suggested taking profits on 15 precious metal investments (Indices, ETFs, individual equities) previously supported since February 1st in a StockTwit and/or this report. Average gain per suggestion was 14.9%. Profit taking was triggered when favourable seasonal influences expired and investments began to underperform the S&P 500 Index. In retrospect, the suggestions were pre-mature. Precious metal investments regained momentum near the end of last week.
Since February1st, Tech Talk has offered 46 additional suggestions through StockTwits/ Tech Talk reports that achieved the following criteria:
· Positive seasonality (confirmed with a seasonality chart)
· Improving technical profile with a technical score of at least 2 (confirmed with a price chart). Most recorded positive strength relative to the S&P 500 Index prior to their selection. Breakouts above resistance levels enhanced their technical score.
All positions currently are profitable and are monitored on a daily basis. As they are “trading” positions that normally are held for less than a month (as opposed to investment positions normally held for 3-7 months), look for news in the near term about taking trading profits. The suggestion to take profits requires a reduction in technical score (probably a drop below their 20 day moving average and/or a downtrend by short term momentum indicators). Stay tuned.
Disclaimer: Seasonality and technical ratings offered in this report by www.timingthemarket.ca and www.equityclock.com are for information only. They should not be considered as advice to purchase or to sell mentioned securities. Data offered in this report is believed to be accurate, but is not guaranteed
Copyright © DV Tech Talk, Timingthemarket.ca


![clip_image002[5] clip_image002[5]](https://advisoranalyst.com/wp-content/uploads/2019/08/e914da4b0e97bbaac634e88839083191.png)
![clip_image002[7] clip_image002[7]](https://advisoranalyst.com/wp-content/uploads/2019/08/0c8e850351cd26c9f089e18e5968e99f.png)
![clip_image002[9] clip_image002[9]](https://advisoranalyst.com/wp-content/uploads/2019/08/287f728dbb9e38f886af0cbaef354687.png)
