For this week's Equity Leaders Weekly, we will update some key Commodities in Natural Gas and Crude Oil. Natural Gas has been one of the worst if not the worst commodity down almost -22% YTD breaking down to under $2 to decade lows while Crude Oil (CL.F) is down almost -14% YTD. The relative strength within the Commodities asset class has clearly separated into Precious Metals (Gold and Silver) at the top and Energy (Crude Oil and Natural Gas) at the bottom of the relative strength rankings.
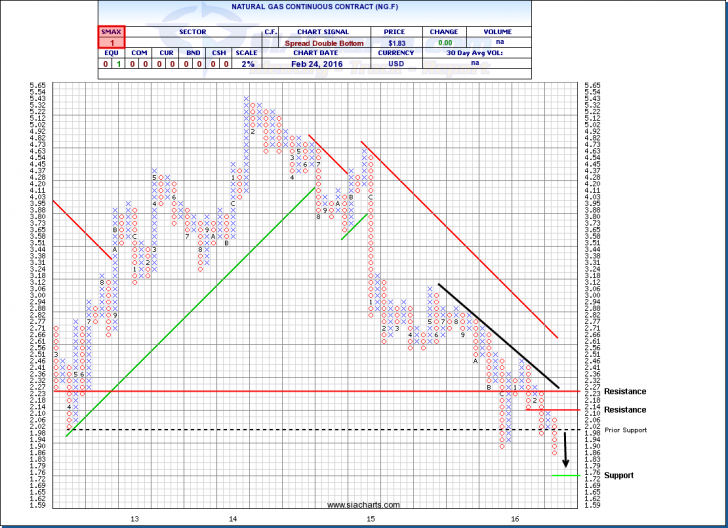
Natural Gas Continuous Contract (NG.F)
When we last looked at the Natural Gas Continuous Contract Future (NG.F) in December of 2015, it had already fallen -44% over the last year and has continued this weakness into 2016 below the $2 mark now down to $1.83. Support could be found below should this weakness continue at $1.72 with resistance above at the prior support level around $2 and at $2.14. With an SMAX score of 1 out of 10, NG.F is still showing short-term weakness across all asset classes.
Oversupply continues to be the theme driving down Natural Gas and Crude Oil from recent numbers released by the U.S. Energy Information Administration. A warmer winter is possibly contributing to smaller-than-average withdrawal from storage coupled with rising natural gas production. The latest weather forecast models suggest that weather may be mild over the next 15 days in several parts of the United States which has led to a continued sell-off among bearish natural gas traders in the near term and continued long-term weakness on a relative strength basis.
Click on Image to Enlarge
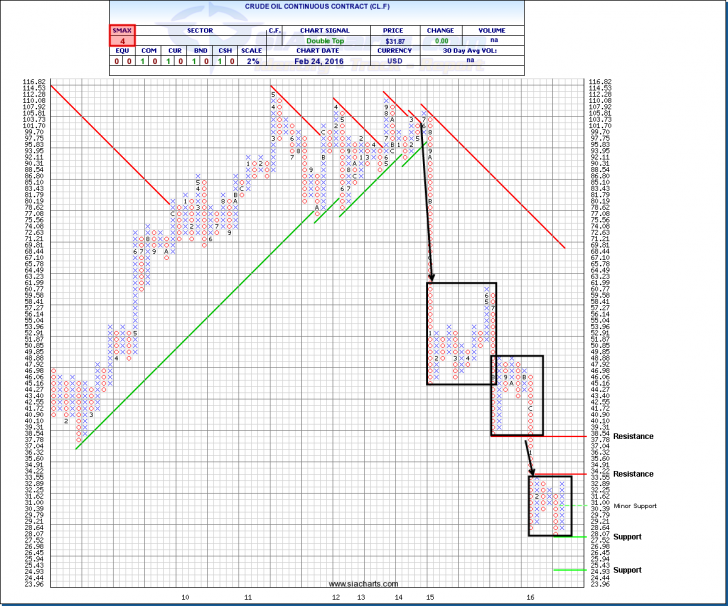
Crude Oil Continuous Contract (CL.F)
Last month when we looked at Crude Oil, we looked a longer-term analysis of the last 20 years at a 3% scale to see how the levels from 1996 could give us some context of the levels CL.F might drop to based on its prior history. This week, we wanted to take a look at some of the trading ranges Crude Oil has found itself in recently to explain the volatility that has been going on week to week and put it in a longer term context. For a majority of 2013 and until October of 2014, Crude Oil traded between $90 and $110 for the most part before collapsing down to its next brief trading range between $45 and $60 for the first half of 2015. The second half of 2015, saw CL.F trade between $37 and $50 before weakening further to its current trading range in 2016 between $27 and $34. Now this current trading range may expand out of these levels up or down as historically, a ~$15 range may be more normal (possibly between $25 and $38 if you look at the support/resistance levels on the chart), but the general direction of these trading ranges has still been on a downward slope leading to lows in oil not seen since the late ‘90s.
The number of oil rigs in the United States fell for a ninth straight week to the lowest level since December 2009, according to data released on Friday by oil services company Baker Hughes, as energy firms continue to cut spending amid the collapse in crude prices. However, the U.S. government's Energy Information Administration said on Wednesday that crude stockpiles rose 3.50 million barrels last week with Gulf Coast inventories rising to their highest levels since ~1990. The daily news is littered with OPEC considering production cuts or ruling them out, but the fact is that supply still outweighs demand in the global market which is forcing Crude Oil prices to stay at lower price levels for longer than most predicted. Until this basic economic principle of supply and demand changes, the long-term relative strength outlook for crude oil continues to show relative weakness. And in light of the past crude oil trading ranges, the increased daily and weekly volatility could be expected in the near-term within these ranges as the relative weakness continues from a long-term perspective.
Click on Image to Enlarge
SIACharts.com specifically represents that it does not give investment advice or advocate the purchase or sale of any security or investment. None of the information contained in this website or document constitutes an offer to sell or the solicitation of an offer to buy any security or other investment or an offer to provide investment services of any kind. Neither SIACharts.com (FundCharts Inc.) nor its third party content providers shall be liable for any errors, inaccuracies or delays in content, or for any actions taken in reliance thereon.
For a more in-depth analysis on the relative strength of the equity markets, bonds, commodities, currencies, etc. or for more information on SIACharts.com, you can contact our customer support at 1-877-668-1332 or at siateam@siacharts.com.
Copyright © SIACharts.com