by Don Vialoux, Timingthemarket.ca
Another Milestone
Number of StockTwit followers @EquityClock exceeded 17,000 on Friday. A previous milestone at 15,000 followers was reached on December 28th
Economic News This Week
December Wholesale Inventories to be released at 10:00 AM EST on Tuesday are expected to be unchanged versus a decline of 0.3% in November
Weekly Initial Jobless Claims to be released at 8:30 AM EST on Thursday are expected to increase to 280,000 from 277,000 last week.
January Retail Sales to be released at 8:30 AM EST on Friday are expected to increase 0.2% versus a decline of 0.1% in December. Excluding auto sales, January Retail Sales are expected to be unchanged versus a decline of 0.1% in December.
December Business Inventories to be released at 10:00 AM EST on Friday are expected to increase 0.1% versus a decline of 0.2% in November
February Michigan Sentiment Index to be released at 10:00 AM EST on Friday is expected to slip to 92.7 from 93.3 in January.
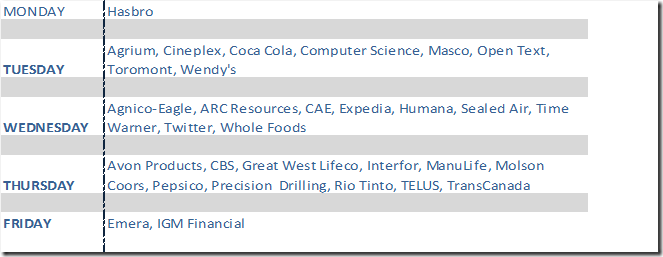
Earnings News This Week
The Bottom Line
More technical evidence surfaced last week that confirmed an intermediate bottom for most equity indices, commodities and sectors on January 21st. Energy, Materials and Industrials began to show strength relative to the S&P 500 Index, an encouraging technical sign for this time of year. However, short term momentum indicators are overbought and some are showing signs of rolling over. Preferred strategy is to accumulate favoured sectors, markets and commodities on weakness as they build base building patterns prior to resumption of an intermediate uptrend.
Equities
Daily Seasonal/Technical Equity Trends for February 5th 2016 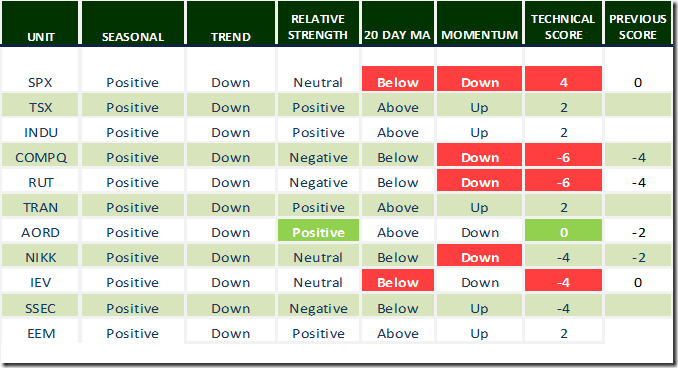
Green: Increase from previous day
Red: Decrease from previous day
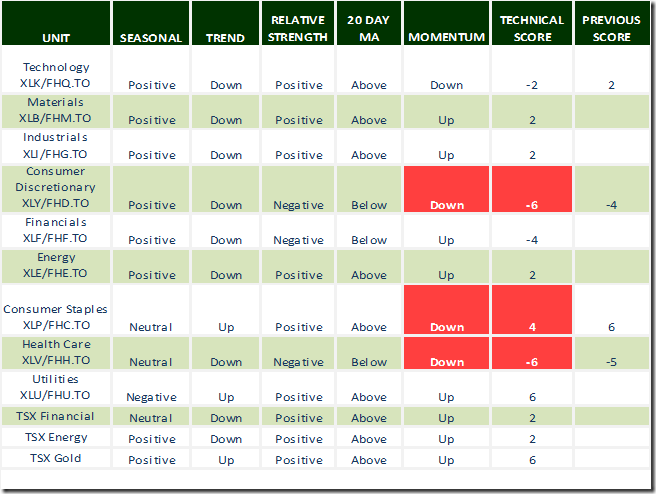
Calculating Technical Scores
Technical scores are calculated as follows:
Intermediate Uptrend based on at least 20 trading days: Score 2
Higher highs and higher lows
Intermediate Neutral trend: Score 0
Not up or down
Intermediate Downtrend: Score -2
Lower highs and lower lows
Outperformance relative to the S&P 500 Index: Score: 2
Neutral Performance relative to the S&P 500 Index: 0
Underperformance relative to the S&P 500 Index: Score –2
Above 20 day moving average: Score 1
At 20 day moving average: Score: 0
Below 20 day moving average: –1
Up trending momentum indicators (Daily Stochastics, RSI and MACD): 1
Mixed momentum indicators: 0
Down trending momentum indicators: –1
Technical scores range from -6 to +6. Technical buy signals based on the above guidelines start when a security advances to at least 0.0, but preferably 2.0 or higher. Technical sell/short signals start when a security descends to 0, but preferably -2.0 or lower.
Long positions require maintaining a technical score of -2.0 or higher. Conversely, a short position requires maintaining a technical score of +2.0 or lower.
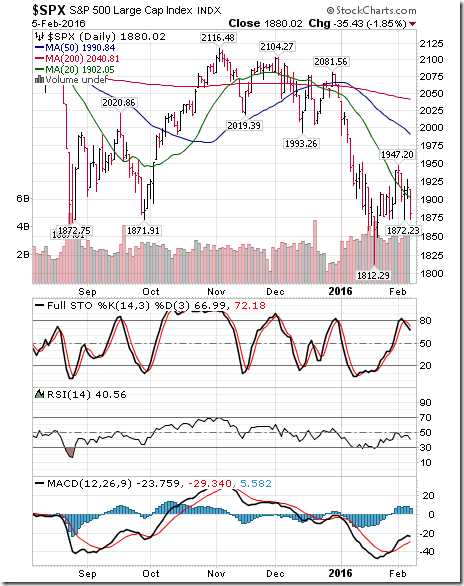
The S&P 500 Index lost 60.21 points (3.10%) last week. Intermediate trend remains down. The Index dropped below its 20 day moving average on Friday. Short term momentum indicators have rolled over from overbought levels.
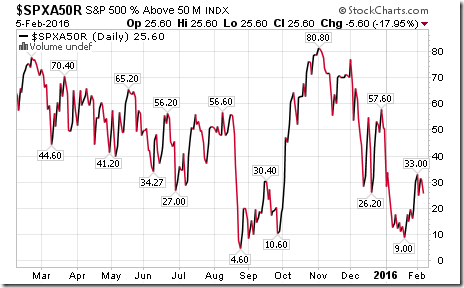
Percent of S&P 500 stocks trading above their 50 day moving average slipped last week to 25.60% from 30.20%. Percent is trending up from an intermediate oversold level.
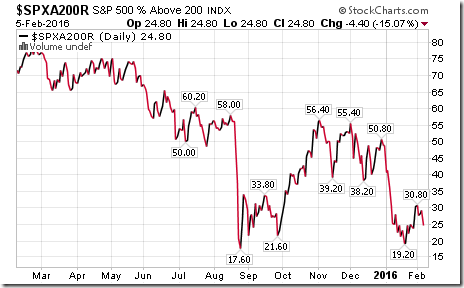
Percent of S&P 500 stocks trading above their 200 day moving average slipped last week to 24.80% from 30.40%. Percent is trending up from an intermediate oversold level.
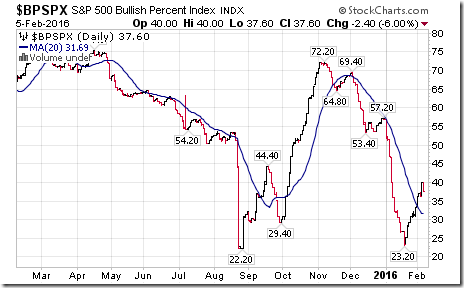
Bullish Percent Index for S&P 500 stocks increased last week to 37.60% from 33.20% and moved above its 20 day moving average. The Index continues to recover from an intermediate oversold level.
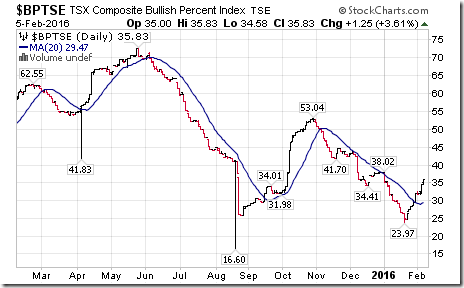
Bullish Percent Index for TSX stocks increased last week to 35.83% from 32.08% and remained above its 20 day moving average. The Index continues to recover from an intermediate oversold level.
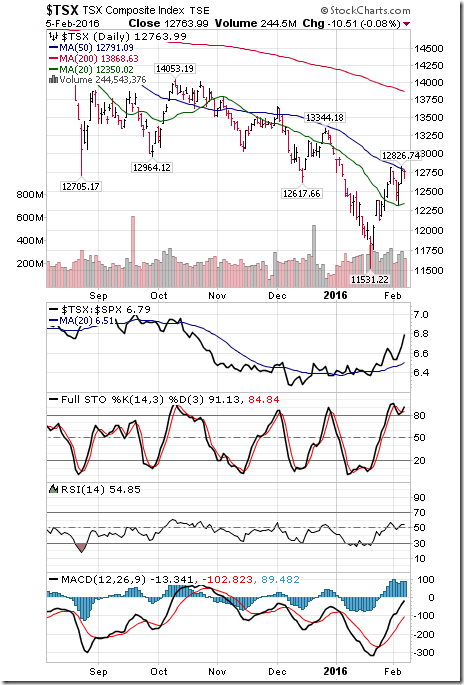
The TSX Composite Index slipped 58.14 points (0.45%) last week. Intermediate trend remains down (Score: -2). Strength relative to the S&P 500 Index remains positive (Score: 2). The Index remains above its 20 day moving average (Score: 1). Short term momentum indicators are trending up (Score: 1). Technical score remained last week at 2.
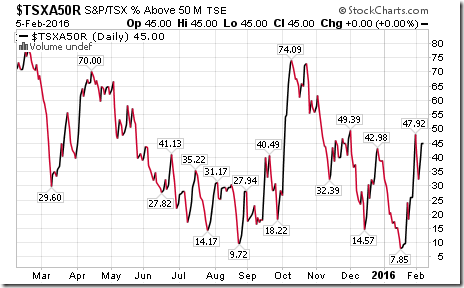
Percent of TSX stocks trading above their 50 day moving average slipped last week to 45.00% from 47.92%. Percent continues to recover from an intermediate oversold level.
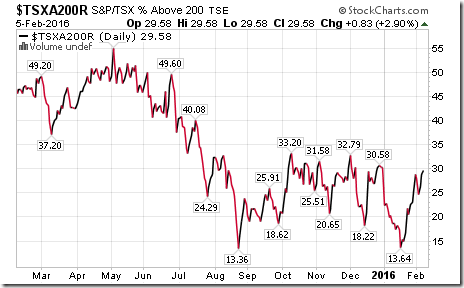
Percent of TSX stocks trading above their 200 day moving average increased last week to 29.58% from 28.75%. Percent continues to recover from an intermediate oversold level.
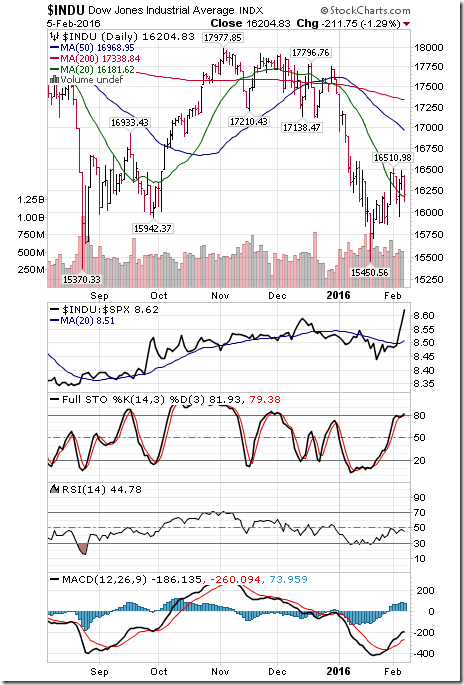
The Dow Jones Industrial Average lost 261.47 points (1.59%) last week. Intermediate trend remains down. Strength relative to the S&P 500 Index turns positive. The Average remains above its 20 day moving average. Short term momentum indicators are trending up. Technical score improved last week to 2 from -2
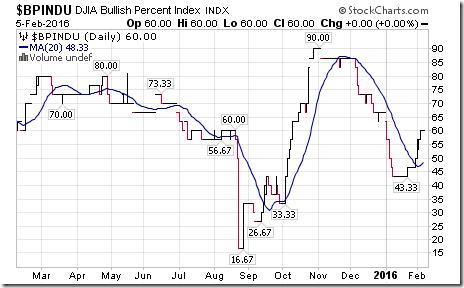
Bullish Percent Index for Dow Jones Industrial Average stocks increased last week to 60.00% from 50.00% and remained above its 20 day moving average. The Index has resumed an intermediate oversold level.
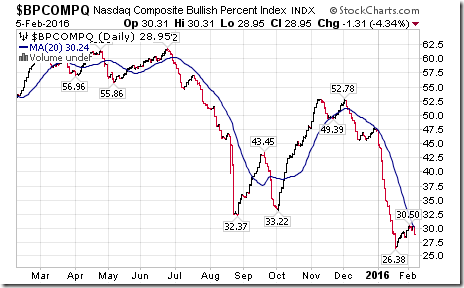
Bullish Percent Index for NASDAQ Composite Index slipped last week to 28.95% from 29.58% and remained below its 20 day moving average. The Index remains intermediate oversold.
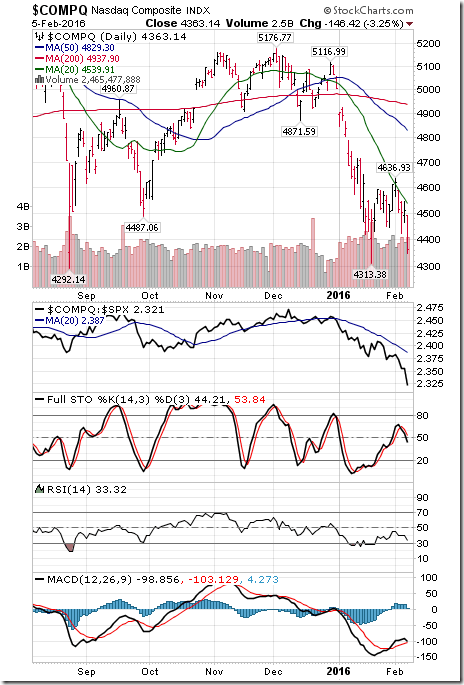
The NASDAQ Composite Index plunged 256.81 points (5.44%) last week. Intermediate trend remains down. Strength relative to the S&P 500 Index remains negative. The Index remains below its 20 day moving average. Short term momentum indicators are trending down. Technical score last week dropped last week to -6 from -4.
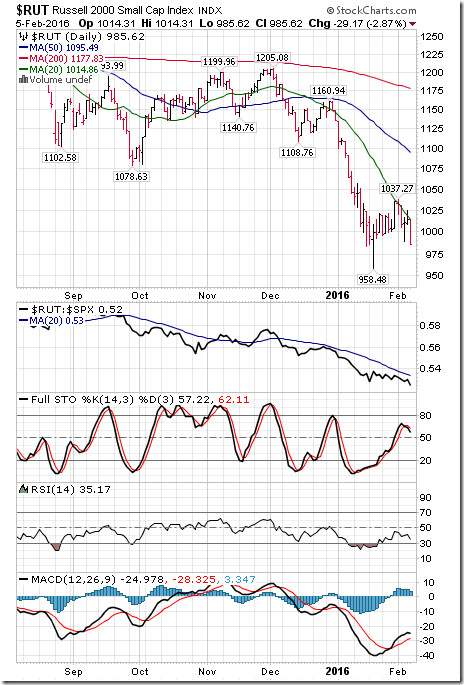
The Russell 2000 Index dropped 49.75 points (4.81%) last week. Intermediate trend remains down. Strength relative to the S&P 500 Index remains negative. The Index remains below its 20 day moving average. Short term momentum indicators are trending down. Technical score slipped last week to -6 from -4.
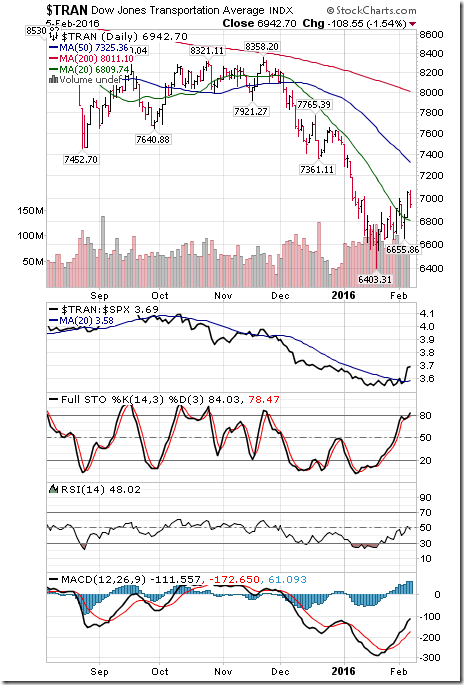
The Dow Jones Transportation Average added 35.94 points (0.52%) last week. Intermediate trend remains down. Strength relative to the S&P 500 Index changed to positive from negative. The Average remained above its 20 day moving average. Short term momentum indicators are trending up. Technical score improved last week to 2 from -2.
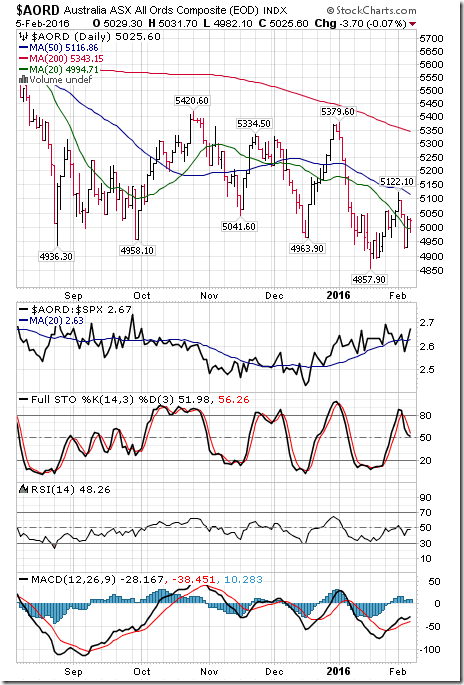
The Australia All Ordinaries Composite Index slipped 31.00 points (0.61%) last week. Intermediate trend remains down. Strength relative to the S&P 500 Index remains positive. The Index remained above its 20 day moving average. Short term momentum indicators are trending down. Technical score slipped last week to 0 from 2.
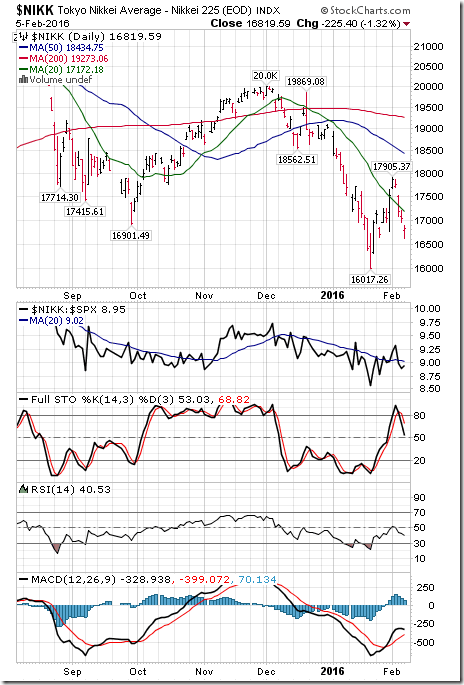
The Nikkei Average dropped 698.71 points (3.99%) last week. Intermediate trend remains down. Strength relative to the S&P 500 Index remained neutral. The Average fell below its 20 day moving average. Short term momentum indicators are trending down. Technical score dropped to -4 from 0.
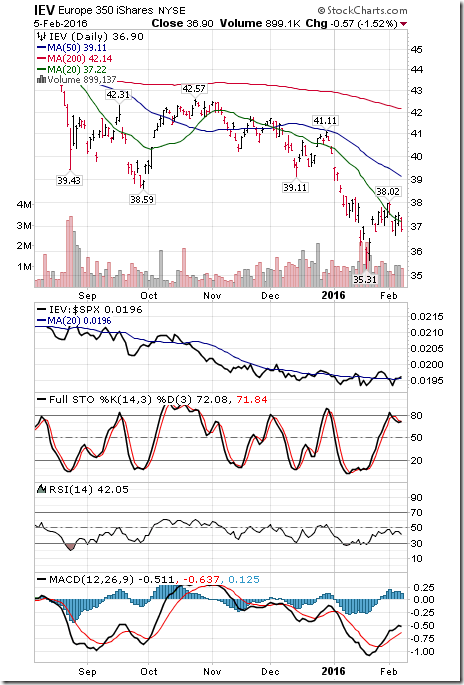
Europe iShares slipped $1.05 (2.77%) last week. Intermediate trend remains down. Strength relative to the S&P 500 Index remained neutral. Units fell below their 20 day moving average on Friday. Short term momentum indicators are trending down. Technical score dropped to -4 from 0.
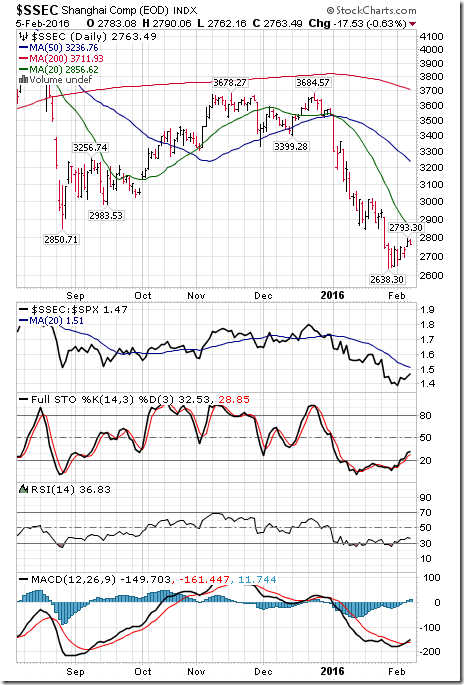
The Shanghai Composite Index added 25.89 points (0.95%) last week. Intermediate trend remains down. Strength relative to the S&P 500 Index remains negative. The Index remains below its 20 day moving average. Short term momentum indicators are trending up. Technical score improved last week to -4 from -5.
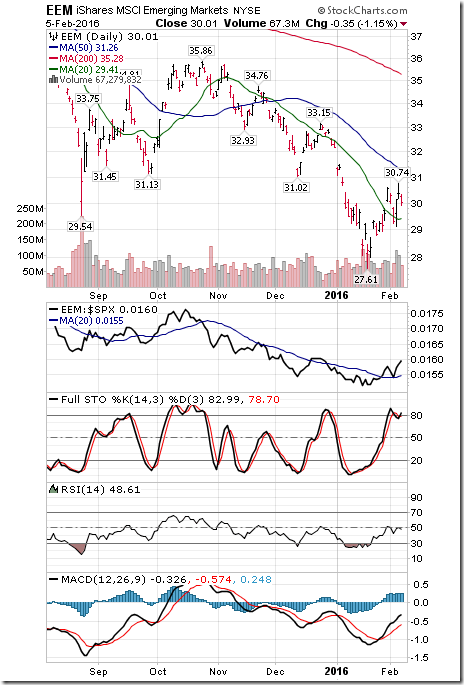
Emerging Markets iShares dropped $0.56 (1.83%) last week. Intermediate trend remains down. Strength relative to the S&P 500 Index remains positive. Units remain above their 20 day moving average. Short term momentum indicators are trending up. Technical score remained last week at 2.
Currencies
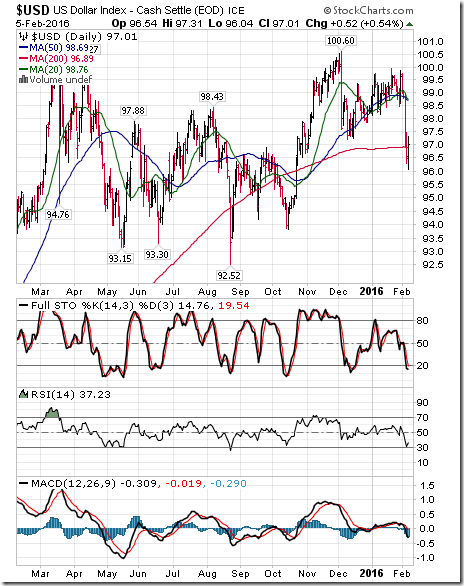
The U.S. Dollar dropped 0.56 (1.83%) last week. Intermediate trend changed to down from up on a move below 97.21. The Index remains below its 20 day moving average. Short term momentum indicators are trending down and are oversold.
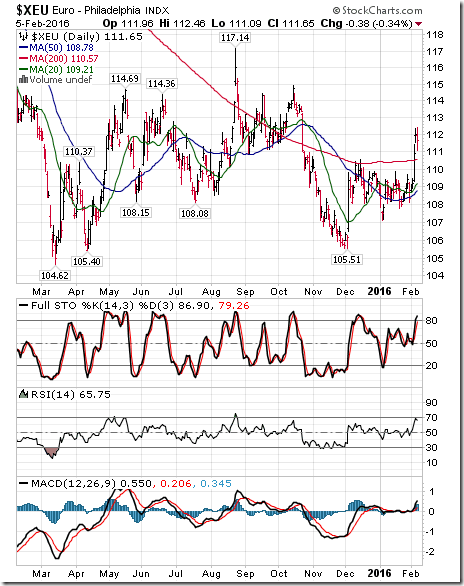
The Euro gained 3.31 (3.06%) last week. Intermediate trend changed to up from down on a move above 110.55. The Euro remains above its 20 day moving average. Short term momentum indicators are trending up and are overbought.
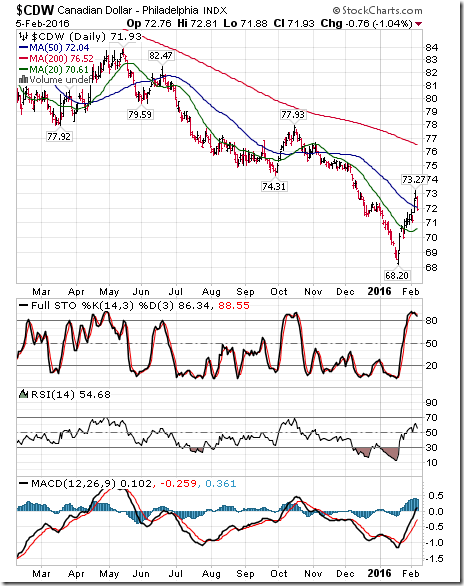
The Canadian Dollar gained US 0.52 cents (0.73%) last week. Intermediate trend remains down. The Canuck Buck remains above its 20 day moving average. Short term momentum indicators are trending up, but are overbought.
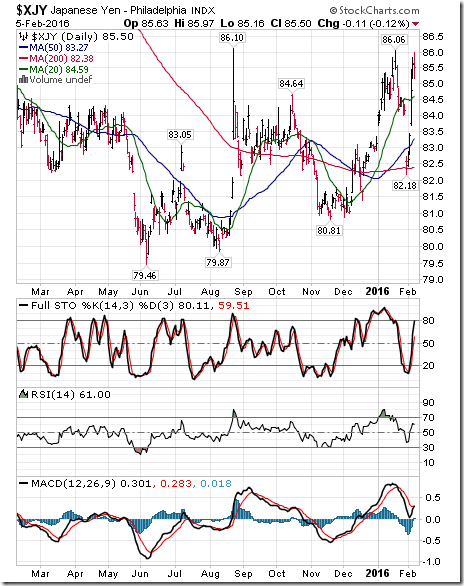
The Japanese Yen gained 1.31 (1.56%) last week. Intermediate trend remains up. The Yen moved back above its 20 day moving average. Short term momentum indicators are trending up.
Commodities
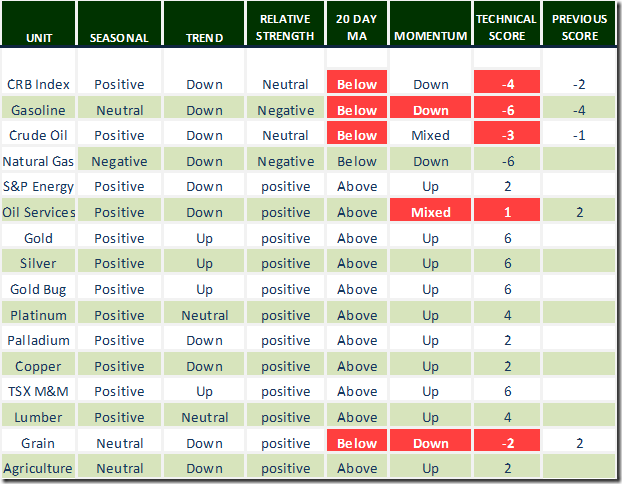
Daily Seasonal/Technical Commodities Trends for February 5th 2016
Green: Increase from previous day
Red: Decrease from previous day
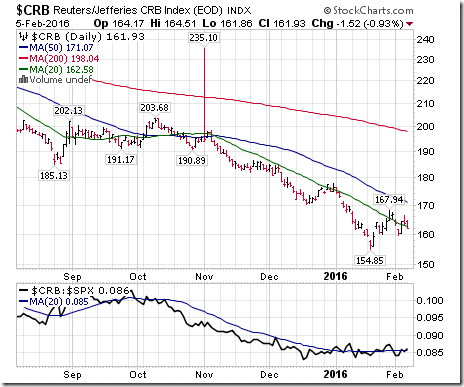
The CRB Index fell 2.89 points (2.89%) last week. Intermediate trend remains down. Strength relative to the S&P 500 Index changed to neutral from positive. The Index fell below its 20 day moving average on Friday. Short term momentum indicators are trending down. Technical score dropped last week to -4 from 2.
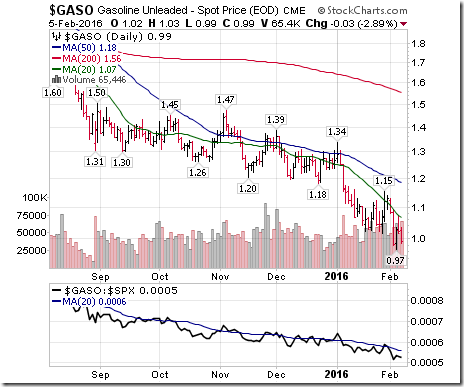
Gasoline plunged $0.14 per gallon (12.39%) last week. Intermediate trend remains down. Strength relative to the S&P 500 Index changed to negative from neutral. Gas moved below its 20 day moving average. Short term momentum indicators are trending down. Technical score dropped last week to -6 from 2.
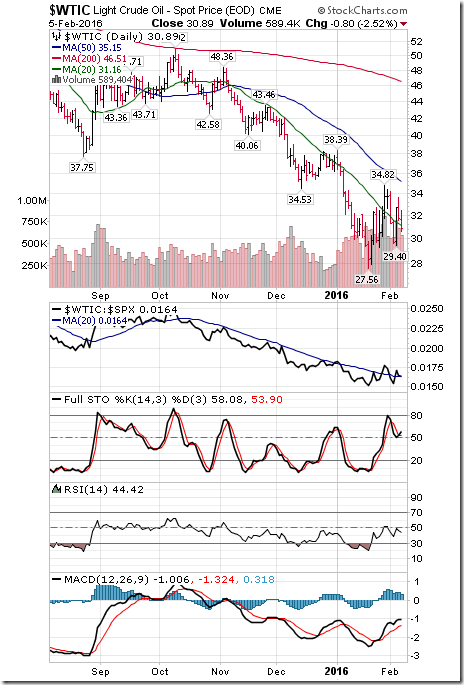
Crude oil dropped $2.73 per barrel (8.12%) last week. Intermediate trend remains down. Strength relative to the S&P 500 Index changed to neutral from positive. Crude fell below its 20 day moving average on Friday. Short term momentum indicators are mixed. Technical score dropped last week to -3 from 2.
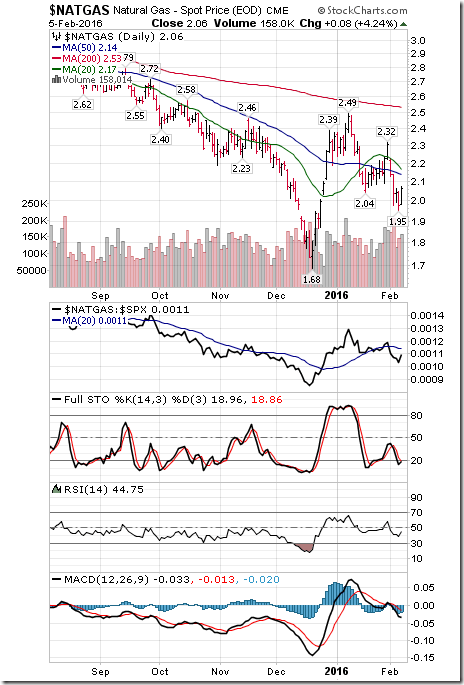
Natural Gas dropped $0.24 per MBtu (10.43%) last week. Intermediate trend changed to down on a move below $2.04. Strength relative to the S&P 500 Index changed to negative from positive. “Natty” dropped below its 20 day moving average. Short term momentum indicators are trending down. Technical score dropped to -6 from 4.
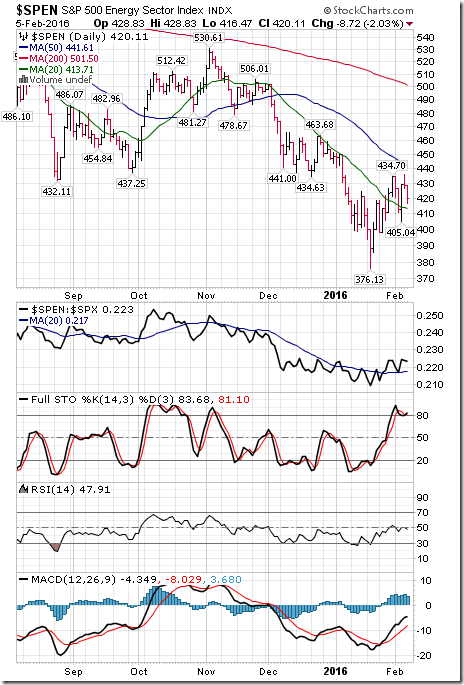
The S&P Energy Index fell 14.56 points (3.35%) last week. Intermediate trend remains down. Strength relative to the S&P 500 Index remains positive. The Index remains above their 20 day moving average. Short term momentum indicators are trending up, but are overbought. Technical score remained last week at 2.
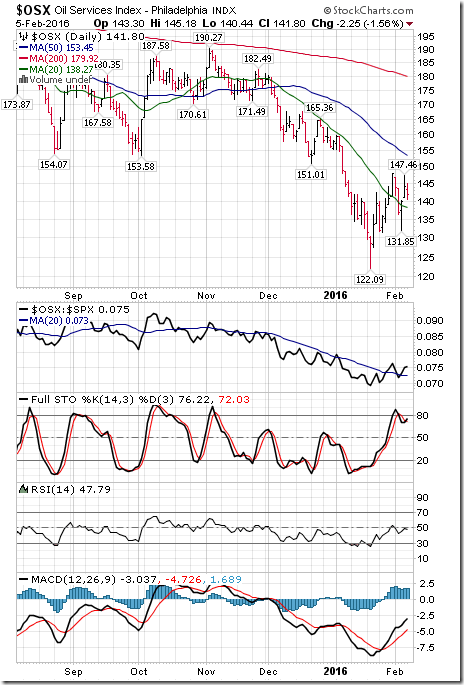
The Philadelphia Oil Services Index dropped 6.25 points (4.22%) last week. Intermediate trend remains down. Strength relative to the S&P 500 Index remains positive. The Index remains above its 20 day moving average. Short term momentum indicators are mixed. Technical score slipped last week to 1 from 2.
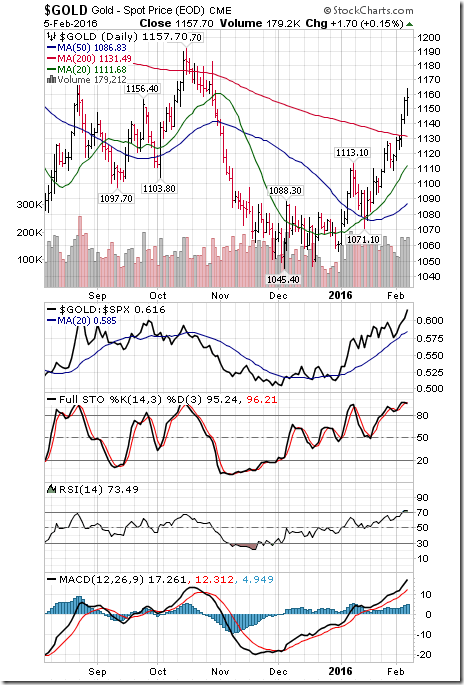
Gold added $41.30 per ounce (3.70%) last week. Intermediate trend remains up. Strength relative to the S&P 500 Index remains positive. Gold remains above its 20 day moving average. Short term momentum indicators are trending up and are overbought. Technical score remained at 6.
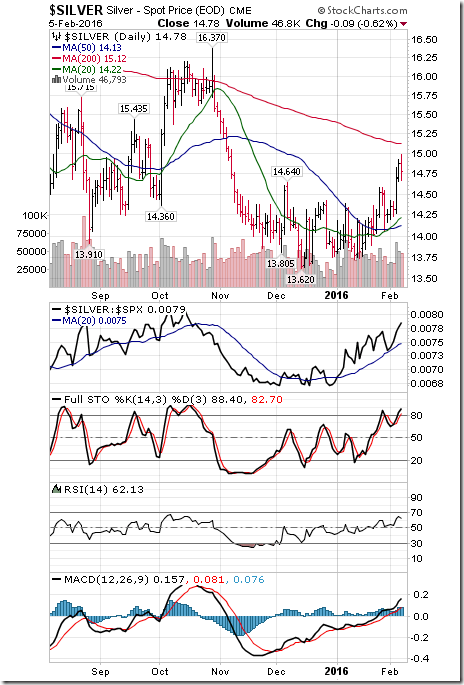
Silver gained $0.54 per ounce (3.79%) last week. Intermediate trend remains up. Strength relative to the S&P 500 Index remains positive. Silver remains above its 20 day moving average. Short term momentum indicators are trending up. Technical score remained at 6. Strength relative to Gold remains neutral.
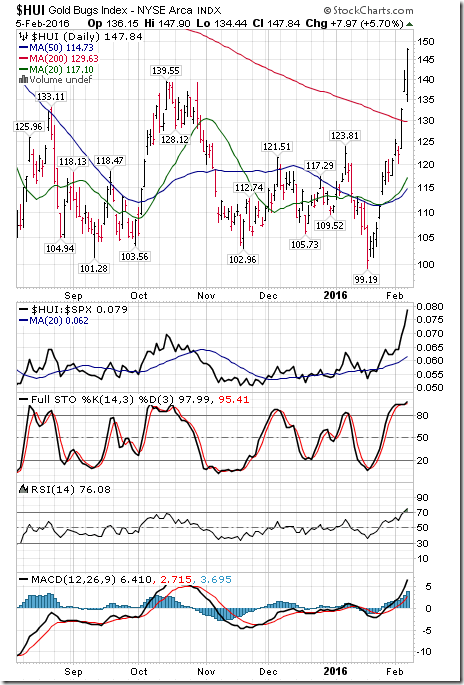
The AMEX Gold Bug Index gained 27.84 points (22.38%) last week. Intermediate trend changed to up from down on a move above 139.55. Strength relative to the S&P 500 Index remains positive. The Index remains above its 20 day moving average. Short term momentum indicators are trending up. Technical score improved last week to 6 from 2. Strength relative to gold remains positive.
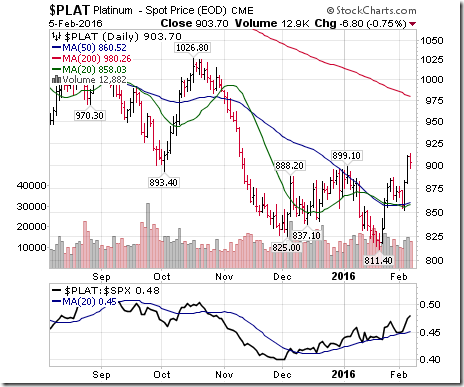
Platinum gained $29.40 per ounce (3.36%) last week. Trend improved to Neutral on a move above $899.10. Relative strength: Positive. Trades above its 20 day MA. Momentum: Positive
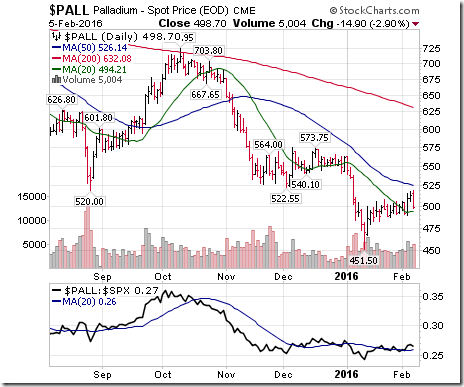
Palladium added $0.20 per ounce (0.04%) last week. Intermediate trend remains down. Strength relative to the S&P 500 Index turned positive. PALL moved above its 20 day MA. Short term momentum indicators are trending up. Technical score improved to 2 from -2.
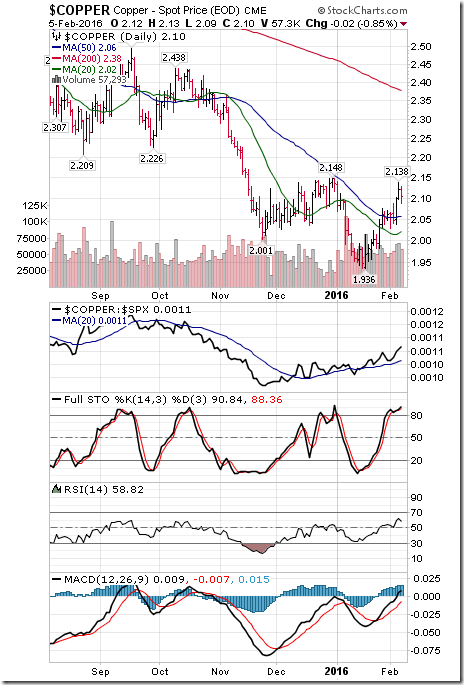
Copper added $0.03 per lb. (1.45%) last week. Intermediate trend remains down. Strength relative to the S&P 500 Index remains positive. Copper remains above its 20 day moving average. Short term momentum indicators are trending higher. Technical score remained last week at 2.
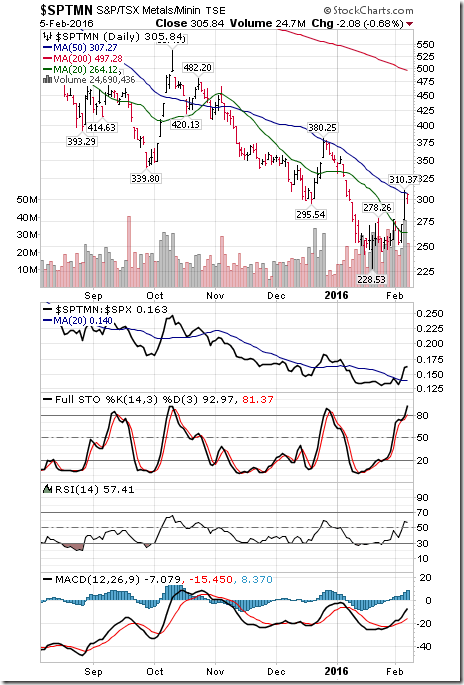
The TSX Metals & Mining Index gained 28.34 points (10.17%) last week. Intermediate trend changed to up from down on a move above 278.26. The Index remained above its 20 day moving average. Short term momentum indicators are trending up. Technical score improved last week to 6 from 0.
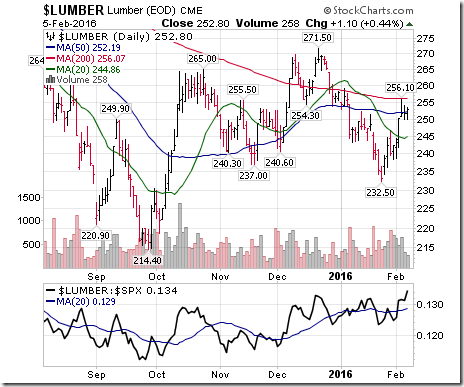
Lumber added $12.40 (5.16%) last week. Trend remains neutral. Strength relative to the S&P 500: Positive. Trades above its 20 day moving average. Momentum: Up. Technical score: 4
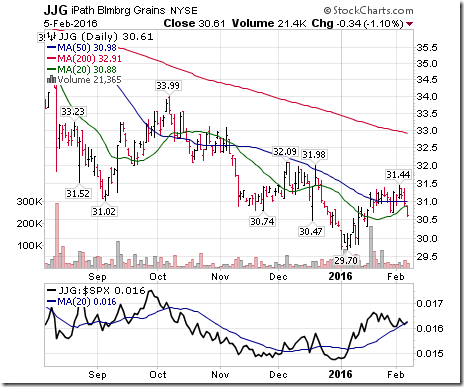
The Grain ETN dipped $0.62 (1.99%) last week. Strength relative to the S&P 500 Index remains positive. Units fell below their 20 day moving average on Friday. Short term momentum indicators are trending down. Technical score improved last week to 2 from -2
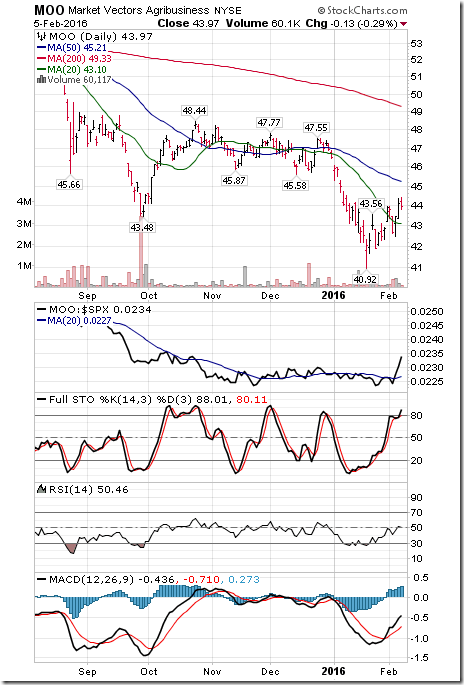
The Agriculture ETF added $0.05 (0.11%) last week. Intermediate trend remains down. Strength relative to the S&P 500 Index remains positive. Units remain above their 20 day moving average. Short term momentum indicators are trending up. Technical score improved last week to 2 from 0.
Interest Rates
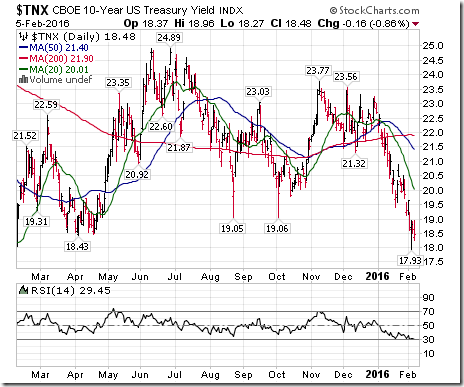
Yield on 10 year Treasuries dipped 8.3 basis points (4.30%) last week. Intermediate trend changed to down from up on a move below 1.905%. Yield remains below its 20 day moving average. Short term momentum indicators are trending down.
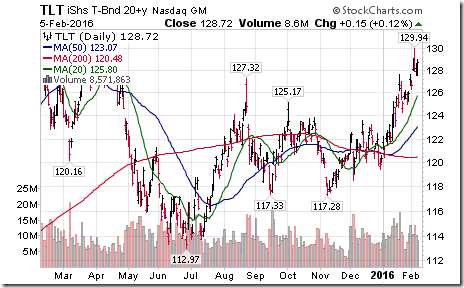
Conversely, price of the long term Treasury ETF gained $1.42 (1.12%) last week. Intermediate trend remains up. Price remains above its 20 day moving average.
Other Issues
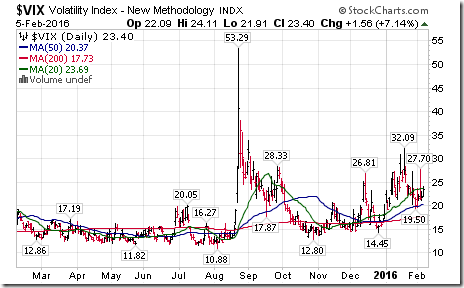
The VIX Index gained 3.30 (16.42%) last week. Intermediate trend remains up. The Index remained below its 20 day moving average.
Economic focus this week is on January Retail Sales to be released on Friday, a report that likely will be mildly bullish.
Fourth quarter reports continue to pour in. To date, 63% of S&P 500 companies have reported with 70% reporting higher than consensus earnings and 48% reporting higher than consensus revenues. On a blended basis, fourth quarter earnings on a year-over-year basis were down 3.8% and fourth quarter revenues were down 3.4%. Responses generally were negative except when earnings and revenues blew out consensus estimates.
Looking forward, 57 companies have issued negative first quarter guidance and 14 companies have issued positive guidance. This week 65 S&P 500 companies are scheduled to report this week as well as 3 Dow Jones Industrial Average companies. According to FactSet, consensus estimates show year-over-year earnings at -5.3% in the first quarter, -0.4% in the second quarter, +5.5% in the third quarter and +10.7% in the fourth quarter.
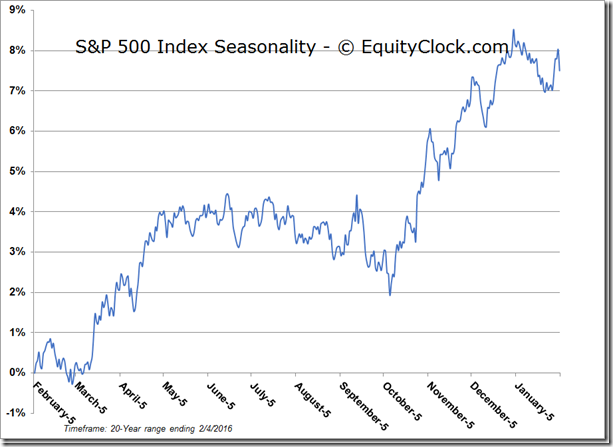
Seasonal influences for most equity indices, commodities and sectors in February historically have been neutral to slightly positive. Frequently, January is a month for intermediate lows and February is the month of base building prior to the spring upsurge. See chart below:
Technical action by individual S&P 500 stocks was surprisingly bullish despite the 3.1% drop by the Index: 34 stocks broke above intermediate resistance levels and 19 broke below intermediate support levels.
Short and intermediate technical indicators for most equity indices, commodities and sectors remained positive last week. However, short term indicators are overbought and showing early signs of peaking.
China is off the radar screen this week due to Chinese New Year celebrations.
StockTwits Released on Friday @EquityClock
Technical action by S&P 500 stocks to 10:30: Quietly bearish. Breakouts: $URBN, $EL, Breakdowns: $HBI, $NWSA, $COP, $ICE, $SRCL, $IGV, $NWA
Editor’s Note: After 10:15 AM, PCAR broke resistance and STZ, QRVO, CLX, PSA and LH broke support.
Interesting Charts
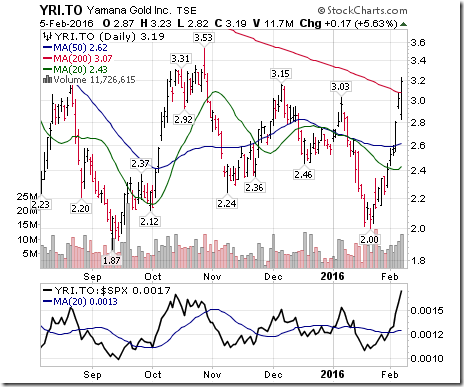
Canadian gold producer stocks were notable on the list of Canadian equities that broke resistance on Friday including Yamana Gold, Kinross and Franco-Nevada.
Sectors
Daily Seasonal/Technical Sector Trends for February 5th 2016
Green: Increase from previous day
Red Decrease from previous day
Special Free Services available through www.equityclock.com
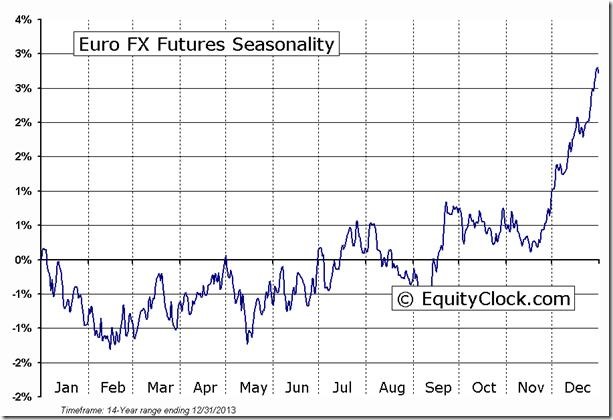
Equityclock.com is offering free access to a data base showing seasonal studies on individual stocks and sectors. The data base holds seasonality studies on over 1000 big and moderate cap securities and indices. To login, simply go to http://www.equityclock.com/charts/ Following are examples:
Disclaimer: Seasonality and technical ratings offered in this report by www.timingthemarket.ca and www.equityclock.com are for information only. They should not be considered as advice to purchase or to sell mentioned securities. Data offered in this report is believed to be accurate, but is not guaranteed.
Copyright © DV Tech Talk, Timingthemarket.ca


