QE Has Not Worked – Period!
by Steve Blumenthal, Capital Management Group, Inc.
February 5, 2016
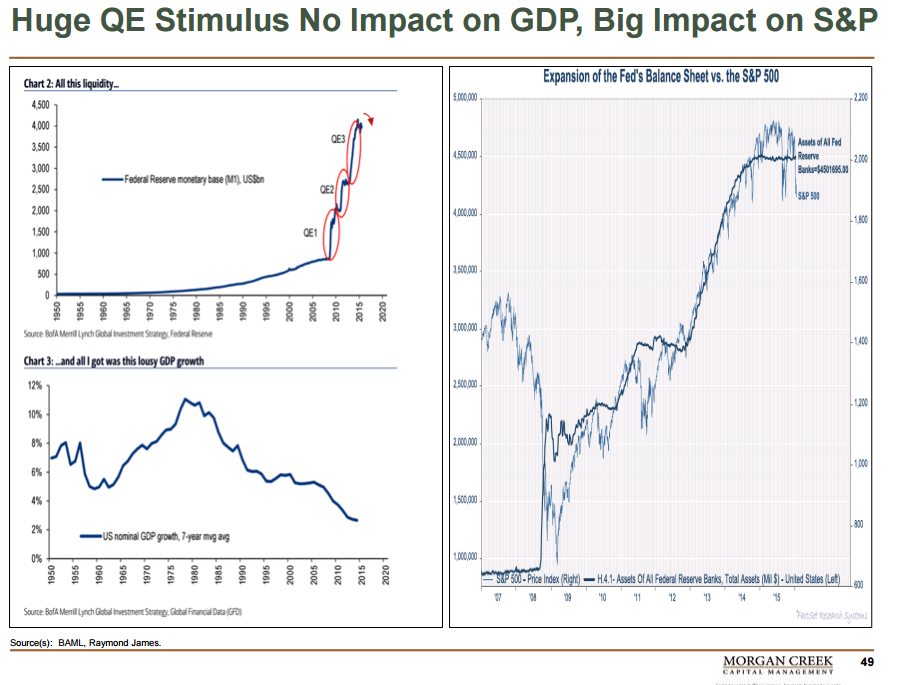
“Clearly, QE has not worked. We have not had one year of 3%+ growth since the Great Recession and are barely averaging 2%. Yes, if your measure is the stock market and other financial assets that have inflated, then QE has worked quite well. But the boost QE was supposed to deliver just hasn’t reached Main Street.
One of the basic tenets of QE and other related policies is that if you want to increase consumption, you lower the cost of borrowing. But if out-of-control borrowing was the original problem, then QE as a solution is kind of like drinking more whiskey in order to sober up.
And if you reduce the earnings of those who are savers so that they are no longer able to spend, the whole purpose of the original project – to foster economic growth – is defeated.
But we (central bankers) can’t acknowledge that, because if we did, we’d have to admit that our theories don’t work. And we all know, because God knows, that our theories are correct.”
John Mauldin, Thoughts from the Frontline – Tokyo Doubles Down
U.S. recession signals are intensifying. The QE boost that hasn’t reached Main Street will be taken away from Wall Street in the next recession.
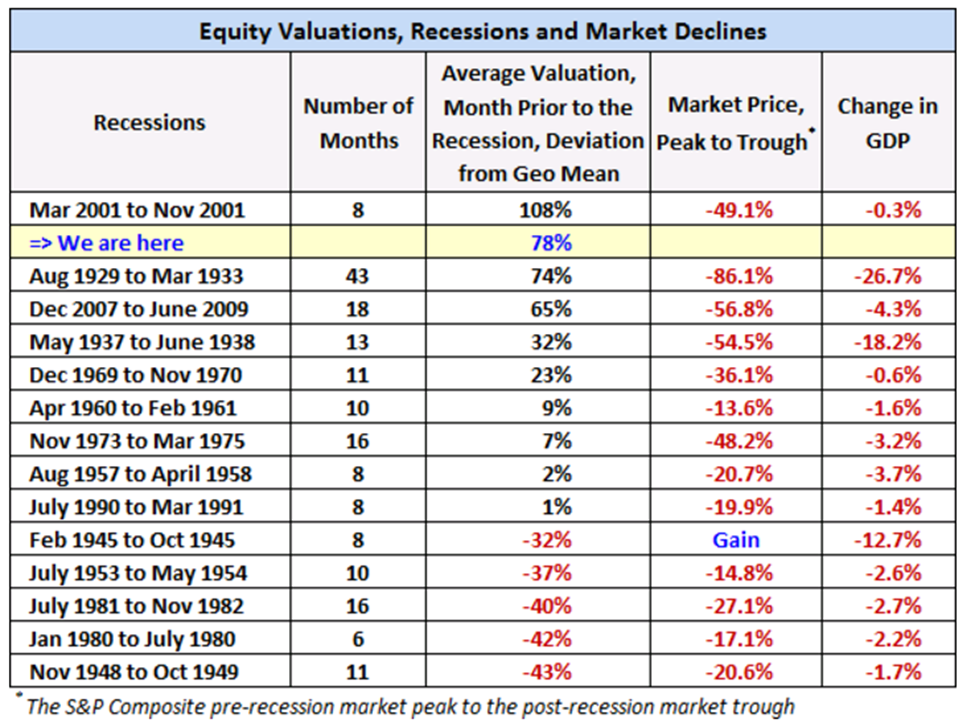
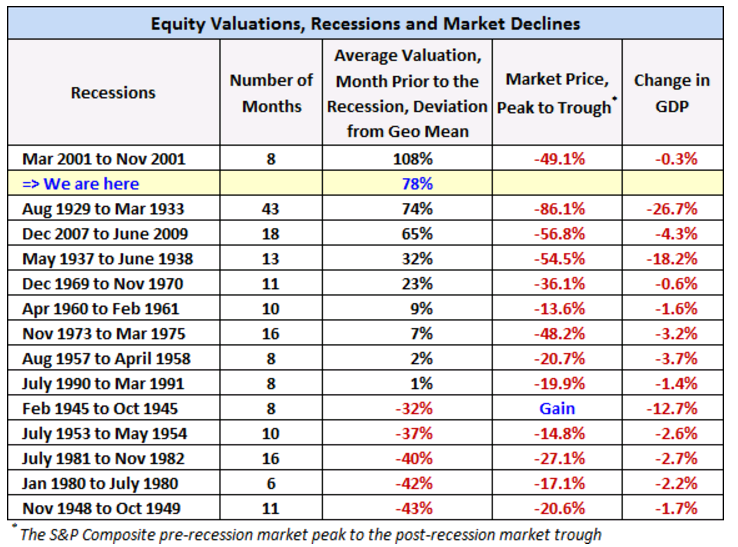
I wrote a piece this week for Forbes entitled, U.S. Recession Signals Intensify . The hard reality is we are due (some say overdue) for a recession and evidence suggests the next one is heading our way. Equity market declines are at their worst during recession as you’ll see in the following chart. View the next chart with a stiff drink in hand. To this, as advisors, we must defend!
Take a look at the “Market Price – Peak to Trough” column. The largest market declines come during recession when your starting points are high valuations (like today).
Source: Advisor Perspectives
The last two recessions saw market declines of -56.8% and -49.1%. Many panicked out near the market lows. Portfolios can be defended and do not need to take that hit. It is the opportunity those dislocations create that we want to position for. A buy when everyone else around us is in panic mode. Recessions follow expansion. Expansion follows recession. Markets cycle.
A brief commercial. Our relative strength tactical strategies are defensively positioned in bonds (which are performing well) and utilities (up nearly 5% in January vs. near -5% for the S&P). Many managed futures strategies are higher year-to-date. Take a look at some of the funds in the Morningstar Multi-Alternative and Managed Futures categories. In my view, recession is a 79% probability and I believe one may have just started (more on that in the charts below). My point is and has been that portfolios can be positioned for both growth and protection. Overweight tactical and managed futures. And hedge that equity exposure. Let’s not be surprised, let’s be prepared.
Look, the debt mess is global in scope and in many places simply unmanageable. Some form of debt restructuring is ahead. “If out-of-control borrowing was the original problem, then QE as a solution is kind of like drinking more whiskey in order to sober up.” Amen, Brother John. The global central bankers are stuck, as my old man used to say, “between a rock and a hard place”.
“Why is this happening? Simply, savers are scared. Lower interest rates have wrecked their retirement plans. Say you were doing some financial planning 10 years ago and plugged in 3% from your savings account. Now its 0%. You still have to plan for your retirement. Plug in 0%. What happens to your planning now? 0% compounded for X years is 0%. The math is simple. So in order to have your target savings at retirement, you need to save more, not spend more.
But for some reason, the economists that run central banks around the world can’t see this. They are all stuck in their offices talking to one another and self-reinforcing this myth that they can drive spending up by reducing the rate of return on investments. Want to see consumer spending go up? Don’t wreck their savings plans so that they are too scared to spend. But that’s too simple. Instead, central banks use a chain of causation that doesn’t exist to try to create change 3 or 4 steps down the line. It hasn’t worked, and it won’t work. It isn’t in an individual’s self-interest to go out and spend their money on more “stuff” in order to spur economic growth.” From Negative Interest Rates – Won’t You Take Me To Funkytown?
Yet for now it is with heads bowed towards the central bankers that we pray, but let’s be clear, we are witnessing an unprecedented economic experiment that is not working and confidence is waning. We are now deeper in debt and absent the hoped-for growth. The next recession will be trickier for the Fed and others to manage.
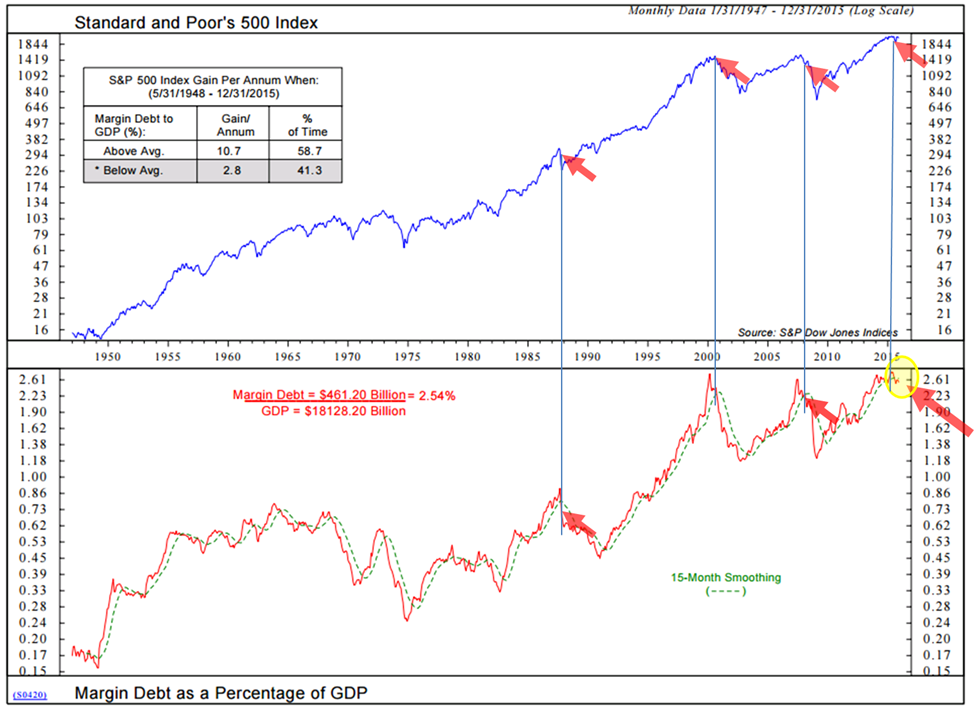
So what are the tea leaves telling us about recession? Let’s take a look at the January month-end data. The signals are intensifying. Let’s also take a look at what is going on with margin debt. Total margin debt peaked mid last year and remains higher than it was in March 2000 and at the peak in 2007. When margin debt begins to unwind, we should take notice. Margin calls, forced selling, would-be buyers step aside, etc. The “unwinding” of investment leverage causes markets to over-react to the downside (aka a “crash”). I think you’ll like the chart I share with you below.
Grab your coffee or a nice glass of wine (it’s Friday) and jump in. There are a lot of charts but it is a pretty quick read; however, if you are 100% invested in equities skip the coffee and down some whiskey. High valuations, excessive investment leverage and periods of recession are a bad mix. It’s gonna get bumpy.
♦ If you are not signed up to receive my weekly On My Radar e-newsletter, you can subscribe here. ♦
Included in this week’s On My Radar:
- Margin Debt at Record High
- Equity Market Valuations
- Recession Watch Chart
- Trade Signals – Margin Debt Flashes Warning
Margin Debt at Record High
Let’s first take a look at margin debt, then valuations and then the probability of recession.
One of the indicators I like to watch and post in Trade Signals from time to time is margin debt. Simply put, markets dislocate when leverage unwinds (would be market makers and buyers step aside). I’ve been concerned for some time about the record high level of margin debt but, in general, most of the time, margin is not a bad thing. It is when it declines below its moving average trend line (“smoothing”) that our concern should grow.
The following chart looks at Margin Debt as a Percentage of GDP and is updated quarterly. It then looks at the current level and compares it to a 15-month smoothing. Risk is elevated when the current reading is below its smoothing. Note the red arrows and the line I drew between them (1987, 2000, 2008 and today). The yellow circle highlights the most recent reading.
Hedge that equity exposure!
Equity Market Valuations
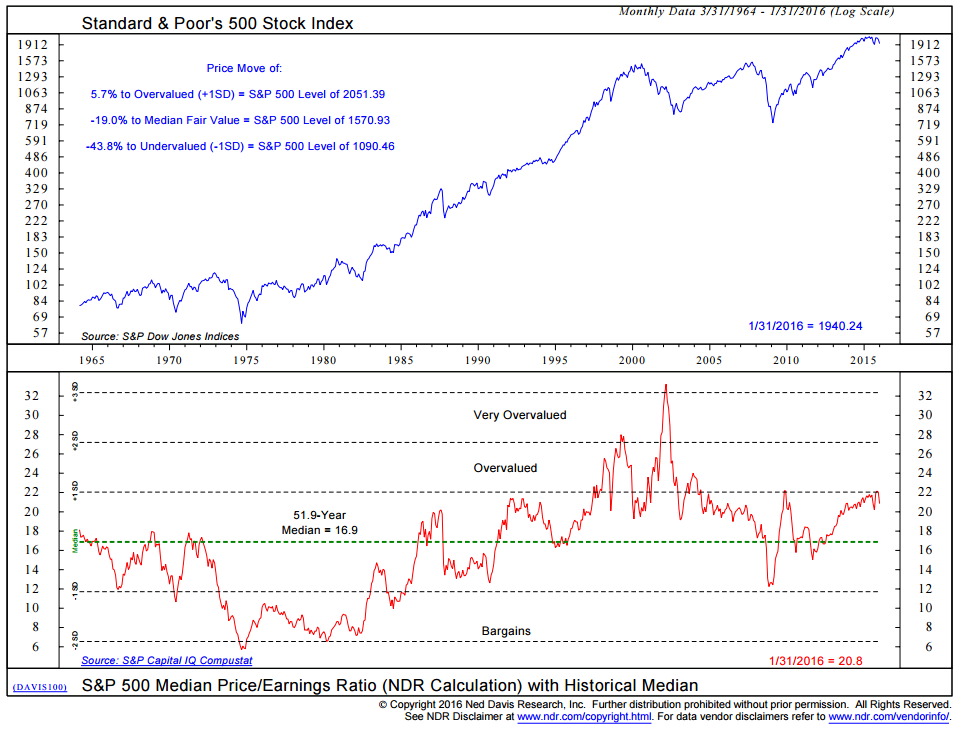
This next chart is my favorite valuation metric. It looks at the median reported P/E ratio and compares it to other points in history. It is currently at 20.8, which is down from last month’s reading of 22. Fair value on the market is at S&P 500 level of 1511. Overvalued is 1989.73 while undervalued is 1032.26. In short, the market is still richly priced.
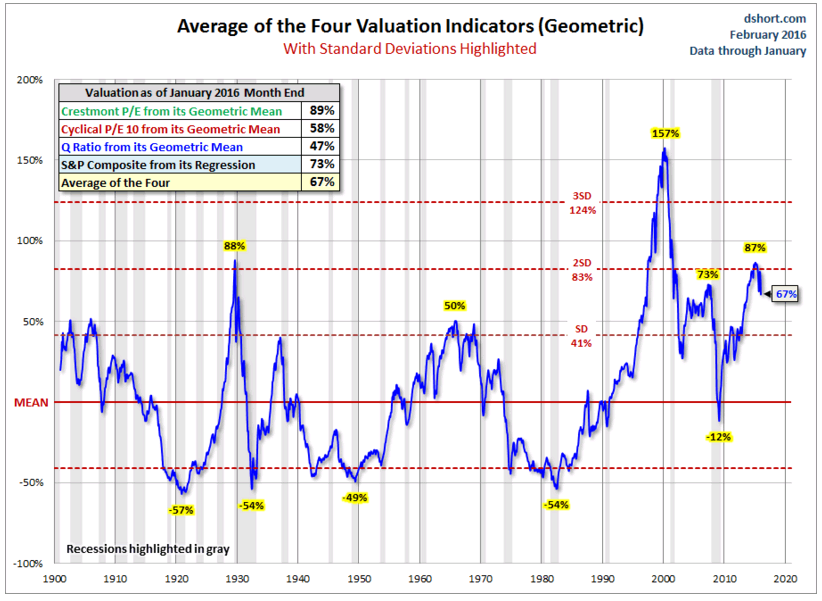
Doug Short at Advisors Perspectives does a great job each month updating valuations. Note in the next chart that valuations reached 87% in May 2015, which was a valuation level higher than 2007’s 73%. Nothing comes close to the crazy level reached in March 2000. Also note, 1929’s 88% overvaluation. Today, the market, by this measure, is 67% away from its mean. Better, but still over-valued. Recessions are highlighted in gray.
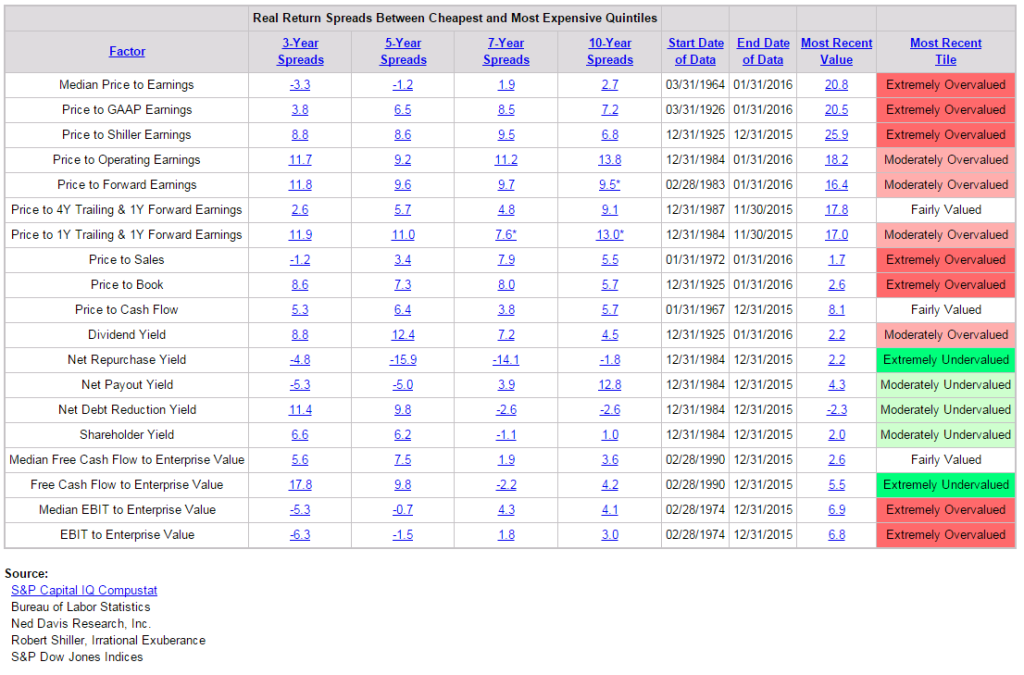
Next is a broader view, a dashboard if you will, of a number of different valuation measures.
By most measures, the market is over-valued. Markets can certainly grow to be far more over-valued than we might think possible. Valuation levels are a good risk metric, but they are a terrible timing indicator; however, when recession hits and margin debt is excessive, markets get into trouble.
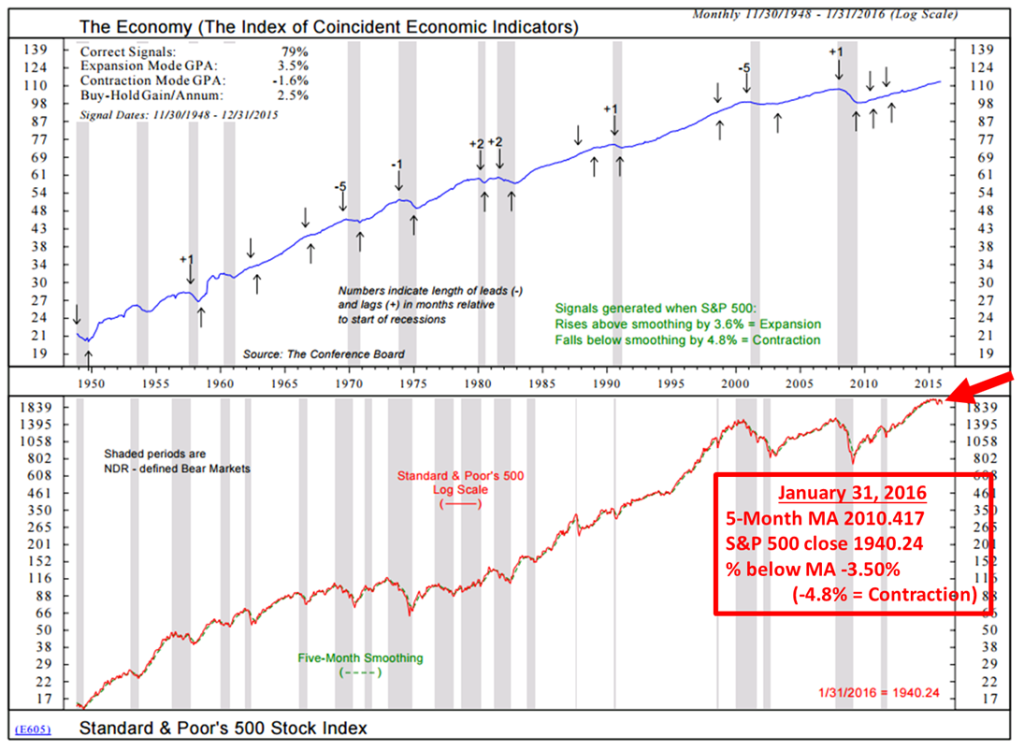
So we need a process that may help us better get in front of an economic recession and what I share next is my favorite. Not perfect, but with a 79% correct signal rate it is the best one I have found.
Recession Watch Update
The reason it is important for us to get in front of recessions is that the equity markets’ largest declines come during recessions. Since a recession is defined as two quarters of negative GDP growth, we only know that they happened well after they started. Accordingly, we need to find a probable way to identify them sooner.
I shared this chart with you in last week’s OMR and warned we were close to a signal. The 2.4% gain on the last day of January prevented the signal from firing but it came close. The chart data is updated through January 31, 2016.
Needed was a decline of 4.8% or move below the five-month smoothed moving average to signal a recession. The market was down 5.6% through Thursday, January 28, and rallied 2.4% on Friday, January 29 (the last trading day of the month). Thus, the market did not close down more than 4.8% below its moving average. However, the S&P 500 declined nearly 2% today and is down approximately 3% for the week. It is clearly more than 4.8% below it’s 5-month smoothing. This process updates monthly so no office trigger until February month end but we should take notice.
Clearly, this is a high probability process and not a perfect process. Perfect is preferred but it just doesn’t exist in this business. We may look back and see the actual recession start date was February 1, 2016. My view is that the risks are so large that a reduction in equity exposure along with a hedging process in place is prudent.
If you missed last week’s post click here and page down to the section entitled, “U.S. Recession Watch Charts.”
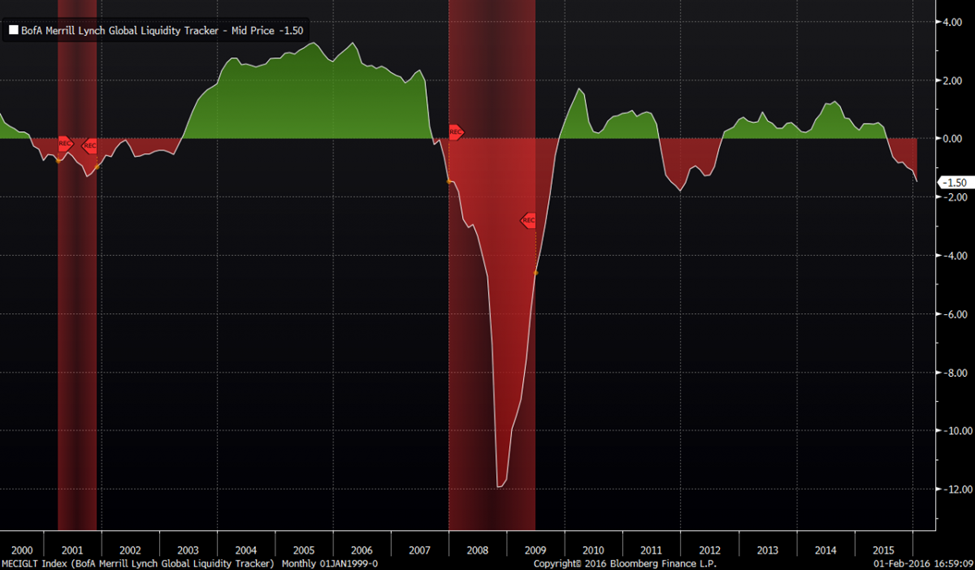
After my Forbes article went to print, I came across the following chart, BofA Merrill Lynch’s Global Liquidity Tracker (the two large red vertical bands mark the last two recessions). Specifically, note the drop into negative territory, indicating recession, at the far right side of the chart. Just saying, the signs are there.
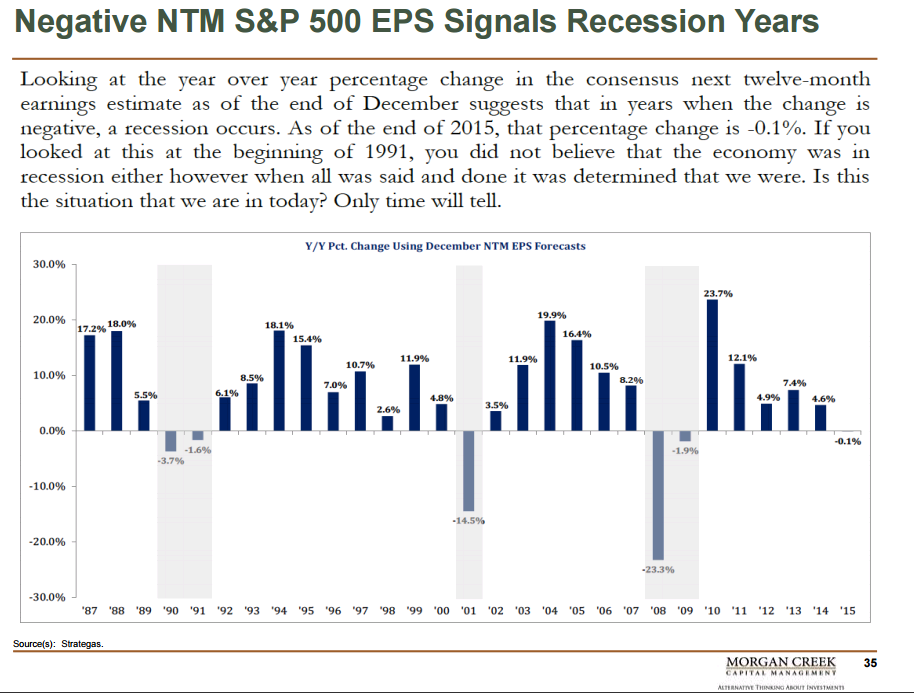
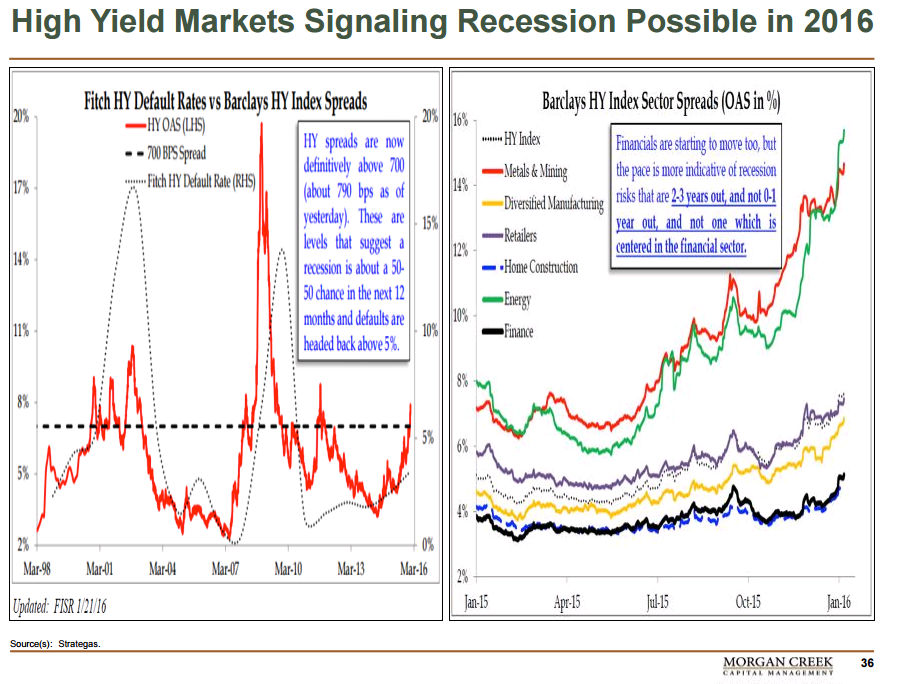
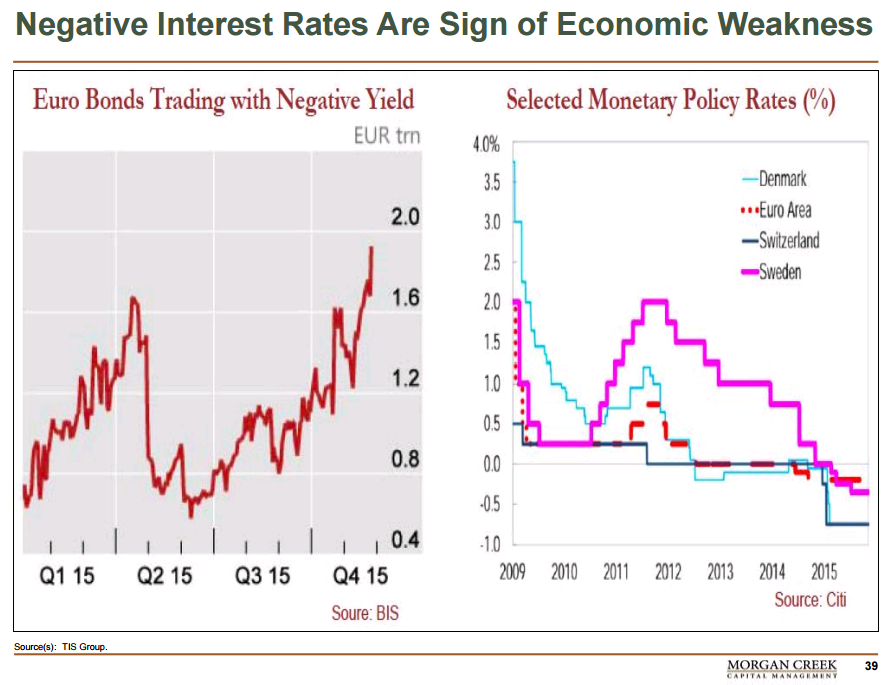
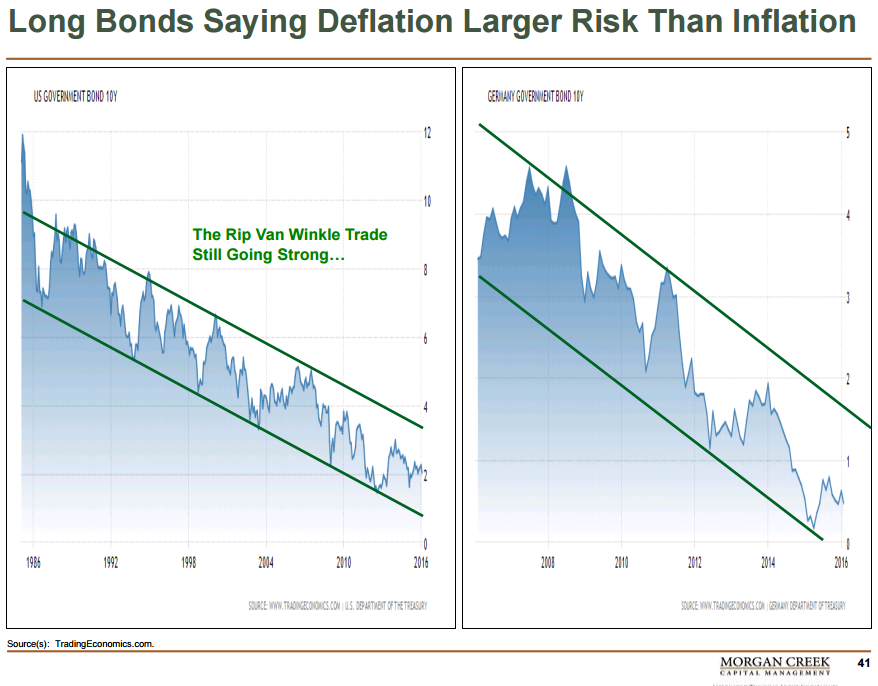
And the following charts on recession from Morgan Creek’s Mark Yusko (who generously shared his ETF.com presentation with me).
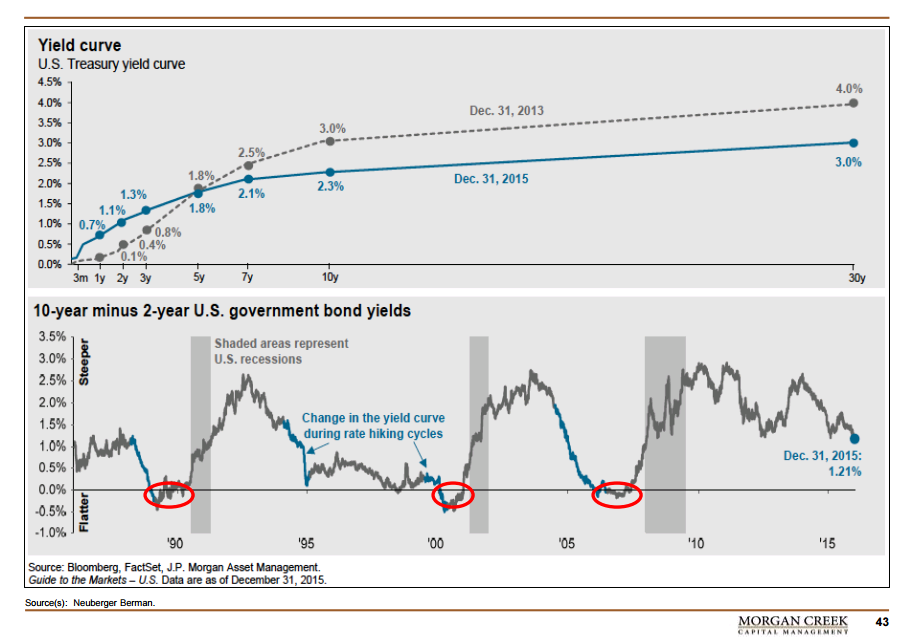
One knock against imminent recession is the next chart: Recessions tend to always follow a negative yield curve. That has not yet happened in this economic cycle. Though there is a lot about central bank policy that is highly unorthodox today (negative interest rates) that would cause me to not apply as much weight on the negative yield curve signal. But keep this data point in your head (note red circles).
It’s not working, it’s not working, it’s just not working.
“Insanity: doing the same thing over and over again and expecting different results.”
– Albert Einstein
As Mauldin stated in the intro quote above, “Clearly, QE has not worked. We have not had one year of 3%+ growth since the Great Recession and are barely averaging 2%. Yes, if your measure is the stock market and other financial assets that have inflated, then QE has worked quite well. But the boost QE was supposed to deliver just hasn’t reached Main Street.”
This is what it looks like in a chart (focus on left side of chart):
And recession and excessive leverage has Wall Street in its sights.
The Impact of Recessions on Equity Markets
Here is one more look at the impact of recession chart. Please feel free to share it with your clients. Just note the source – Advisor Perspectives.
Also note the highlighted “We are here” line that the mean was 78% at the end of December 2015. That number is now 67% due to the market decline in January. Still high by historical measures.
The next section are the highlights of Wednesday’s Trade Signals web post. The overall trend remains bearish for equities. Our CMG NDR Large Cap Momentum Index has been in a sell signal since 6-30-2015. So far so good. Investor sentiment is the lone bright spot.
Trade Signals – Margin Debt Flashes Warning
Our primary equity market indicator, the CMG Ned Davis Research Large Cap Momentum Index remains in a “SELL.” CMG HY is back in a “SELL.” The market is not on solid footing.
Included in this week’s Trade Signals:
Equity Trade Signals:
- CMG NDR Large Cap Momentum Index: Sell Signal – Bearish for Equities
- Long-term Trend (13/34-Week EMA) on the S&P 500 Index: Sell Signal — Bearish for Equities
- Volume Demand is greater than Volume Supply: Sell Signal – Bearish for Equities
- NDR Big Mo: See note below (active signal: sell signal on 1-15-16).
Investor Sentiment Indicators:
- NDR Crowd Sentiment Poll: Extreme Pessimism (short-term Bullish for Equities)
- Daily Trading Sentiment Composite: Extreme Pessimism (short-term Bullish for Equities)
Fixed Income Trade Signals:
- The Zweig Bond Model: Sell Signal
- High-Yield Model: Sell Signal
Economic Indicators:
- Don’t Fight the Tape or the Fed: Indicator Reading = 0 (Neutral for Equities)
- Global Recession Watch Indicator – High Global Recession Risk
- S. Recession Watch Indicator –Low U.S. Recession Risk (Though Nearing a Recession Signal)
Tactical All Asset Model:
- Relative Strength Leadership Trends: Utilities, Fixed Income, Muni Bonds, Gold and are showing the strongest relative strength:
Click here for the link to the full Trade Signals (updated charts and commentary).
Personal note
So we stand at our post and watch closely for recession. Short-term frustrating for you and me but it is the other side of the trade that we want to be prepared for and that day, I believe, is nearing.
If you are about to go out and bop your financial advisor on the head, just know that the environment in 2015 was one of the most difficult investment environments in years. This from Blackrock’s Rick Reeder:
“Last year wasn’t a great one for investors seeking solid returns. No year since 1990 has seen more asset classes finish in negative territory than 2015, even if losses were more extreme in 2008, according to a BlackRock analysis using Bloomberg data and looking at the average of annual total returns for oil prices, gold prices, ten fixed income indices and three equity indices.
In fact, according to the Bloomberg data, in 2008 there were arguably more places one could take refuge, as U.S. Treasury and Agency debt, broad aggregate fixed income indices and gold all provided a bulwark against steep equity losses. In contrast, last year, while the extent of losses was more muted than in 2008, losses were more widespread across asset classes, the data show. Given the correlation between asset classes, there were fewer opportunities to sidestep trouble and take refuge.”
Source: BlackRock, Inc.
Here is the link again to the Forbes article. Please let me know what you think. Also, email me if you’d like a few ideas around your total portfolio construction. As I mentioned above, a number of investments are doing well. Particularly, tactical strategies that can pivot to bonds and other more defensive positions are doing well as are a number of fund in the Morningstar’s Multi-Alternative and Managed Futures categories. It’s not all bad out there.
I’m heading back to Naples, Florida on February 29 for the CBOE Risk Management Conference. We do a lot of hedging within one of our equity funds and I’m looking forward to a spirited few days. We trade ETF-based options and have experienced firsthand the growth in liquidity, trading volume and the tightening in bid/ask spreads. I’m looking forward to learning more.
Dallas follows the first week of March for a mutual fund gathering of key platform decision-makers. I will travel to Indianapolis in mid-March for an Advisors client event and to San Francisco on March 23rd for several meetings.
Our weekend plans are looking fun. A “rail jam” ski event is scheduled for tomorrow for our Matthew and post that, Susan and I will be rushing the boys back into the car to see our nephew Will play basketball. He’s “all that” we have come to learn and his high school team is down from Albany, NY for a Philadelphia-area tournament. There is a lot of excitement around the house as the boys are trying to figure out how to best embarrass their cousin during the game.
And, of course, the Super Bowl is Sunday. I’m an underdog kind of guy, so I’m pulling for Peyton. Friends are coming over and I see a cold IPA in my future. Should be a lot of fun.
Thank you for your interest in my weekly missives. It is very much appreciated.
Best wishes to you and your family! Have a fun weekend! Go Denver though I so wish it were my Eagles!
♦ If you are not signed up to receive my weekly On My Radar e-newsletter, you can subscribe here. ♦
With kind regards,
Steve
Stephen B. Blumenthal
Chairman & CEO
CMG Capital Management Group, Inc.
Stephen Blumenthal founded CMG Capital Management Group in 1992 and serves today as its Chairman and CEO. Steve authors a free weekly e-letter entitled, On My Radar. The letter is designed to bring clarity on the economy, interest rates, valuations and market trend and what that all means in regards to investment opportunities and portfolio positioning. Click here to receive his free weekly e-letter.
Copyright © Capital Management Group, Inc.


