What's going on?
by Michael Batnick, The Irrelevant Investor
“What the hell’s going on out here?” Vince Lombardi
The S&P 500 began the first ten days of the year with an 8% loss, it’s worst opening performance ever. While there are 475 different 10-day periods worse than the 2016 open, the 8% decline was still pretty bad, faring worse than 98% of all ten-day returns.
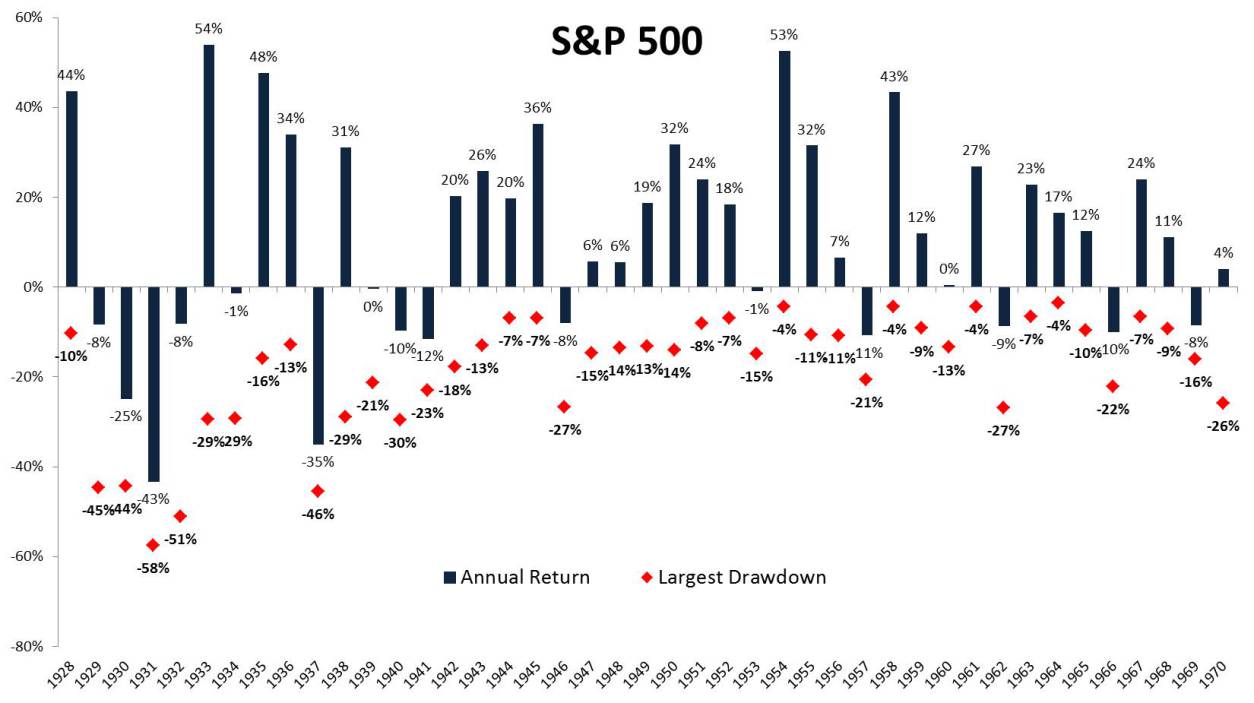
So here we are, not even through January, and already we’ve experienced a 11.3% drawdown in the S&P 500. Should this give us reason for concern? Time will tell, but for now, we can say that these sort of intra-year drawdowns are par for the course.
Here are a few takeaways:
- The average intra-year decline is 16.4%. This current decline might feels worse due to the speed at which it’s happening, and because it’s occurring right out of the gate.
- Double digit declines are to be expected, 64% of all years experienced them.
- It’s not unusual for those double digit declines to be of little importance. 57% of the years with 10% drawdowns finished positive.
- Stated differently, 36% of all years saw a double digit decline and still finished positive.
- Drawdowns of 20% or more have happened 23 times, or 26% of all years. On five of those 23 occasions, stocks still ended up positive on the year.
Staying invested when the stocks are seemingly dropping every day is extremely difficult, which is why the long-term rewards can be so bountiful. Compounding your wealth at 5% after inflation for twenty years- a very reasonable goal- results in a 165% gain. In order to be the beneficiary of these returns, you have to accept some painful, but temporary declines along the way, which for most people is incredibly difficult to do. However, the difficulty of staying invested pales in comparison to the difficulty of consistently getting out and back in at the right time.
**The idea for this chart comes from the awesome J.P. Morgan Guides to the market


